Showing posts with label Environment. Show all posts

Sunday, 15 February 2015

India: Growth and Emission

International Monetary Fund envisages India to grow at 6.5% by the end of 2016, eventually surpassing China, in its recently published World Economic Outlook. IMF lays its opinion on the new policy driven government in India and gradual slump in Chinese demand.


This should not be viewed as China passing its torch of aggressive growth to India. The law of diminishing return suggests that the country with lower GDP has greater growth prospects than the country with higher GDP. Indian GDP being amply lower than China, implies that India has not yet realized its true growth opportunities.


The new regime in India is expected to remove the impediments that have hampered its growth. Both India and China have a long way to go before they attain the standards of a developed nation.


It is imperative that both India and China will need energy to fuel its growth. During this course, they will be emitting a tremendous amount of greenhouse gases into the atmosphere. A glance at Emission Intensity – a measure of amount of Carbon Dioxide emitted per unit of GDP created – pattern gives us a clear picture on the room for efficiency gain available in these countries.


It will be interesting to see how the policies in the new Indian regime will unfold to ensure its adherence to the global effort to limit greenhouse gas (GHG) emissions.

The Paris Summit

The United Nations Framework Convention on Climate Change (UNFCCC) has impelled every country to commit to a quantified action plan - Intended Nationally Determined Contributions (INDC) - to deter GHG emission. The terms in INDC will be open to negotiation in the Paris Summit scheduled for December 2015. The foundation to the Paris Summit was strengthened during the Lima Conference where several countries agreed upon the critical key points.

After the momentous US-Sino deal on emission during the APEC meet, all eyes are upon India to take the initiative. US has agreed to reduce its emission by 26-28% below its 2005 level by 2025 and China will peak its Carbon Dioxide emission by 2030.

It was not a difficult commitment for China to make. It has already brought 500 million people out of poverty since its market reforms, achieving 98% electrification of home. It is far ahead of India on the development curve and its GDP growth is expected to decline in future. It also has controlled its rapid population growth. With all these factors and its expertise in clean energy technology, it is expected that China's demand for fossil fuel will peak soon.

India's Stand

India is nowhere near China in its success story. The new regime has rekindled a hope for Indians. It will certainly need a lot of energy to let its dreams materialize. This inhibits it from making any commitment in regards of emissions. However its ambitious plans in clean energy suggest that it has already taken the rain check.

"India's development imperatives cannot be sacrificed at the altar of potential climate changes many years in the future. The West will have to recognize we have the needs of the poor." - Piyush Goyal, India's Power Minister


Although India is the third largest emitter of Carbon Dioxide, it is substantially below the level of emissions by US and China, both in absolute and per capita terms. It is not the current level of Indian emissions that concerns the international community. The fact that the development of India is delayed gives it an advantage to harness the modern energy efficient technology to bolster its growth. Thus the responsibility lies upon India to avail the cleaner technology and not commit the same mistake that the now developed countries have done.

With the environment centric approach and "Make in India" concept, Prime Minister Modi has assured the world of India's devotion to abate climate change.


Bibliography
  1. IMF
  2. Foreign Policy
  3. WRI
  4. UNFCCC
  5. Brookings Institute

Data Sources
  1. World Bank
  2. BP
  3. EIA


Sunday, 14 December 2014

Kyoto Protocol & Emission Trading

Since the inception of the Industrial Revolution in the late eighteenth century, our society has undergone drastic changes. The advent of manufacturing industries, construction business and transportation has been emblematic to the human development. These changes would not have been possible without the fossil fuels. The countries that identified the true potential of the fossil fuels and developed their ability to harness energy from them, climbed up the ladder of economic development.

We are now beginning to identify the true repercussions of exploitation of the natural resources and the imbalance it creates in our fragile ecosystem. The recent comprehensive report published by Intergovernmental Panel on Climate Change (IPCC) points out the impact of climate change and the cost of a stymied environmental policy.

Some of the poignant consequences that are elucidated in the report are:
  • The requirement to build necessary infrastructure to adapt ourselves to extreme climate
  • loss of land due to increased sea level
  • decline in marine resources
  • vagaries in weather pattern leading to tumultuous crop output


Kyoto Protocol

Kyoto had been the capital of Japan from 1180-1868

Kyoto Protocol is a set of binding obligations set up by the United Nations Framework Convention on Climate Change (UNFCCC) upon industrialized nations to curb their greenhouse gas (GHG) emissions. UNFCCC recognizes that the current level of GHG is primarily due to the industrial activities that the now-developed countries undertook for their development in the past couple of centuries. The developed countries bear the heavier burden under the principle of common but differentiated responsibilities.

The Kyoto Protocol was adopted in Kyoto, Japan, on 11 December 1997 and entered into force on 16 February 2005. It had set two commitment periods for its member countries:
  1. First Commitment Period – 1st January 2008 to 31st December 2012
  2. Second Commitment Period – 1st January 2013 to 31st December 2020

Objective

The objective of Kyoto Protocol and UNFCCC is to stabilize greenhouse gas concentrations at a level that would prevent dangerous anthropogenic interference with the climate system. It states that such a level should be achieved within a time-frame sufficient to allow ecosystems to adapt naturally to climate change, to ensure that food production is not threatened, and to enable economic development to proceed in a sustainable manner.

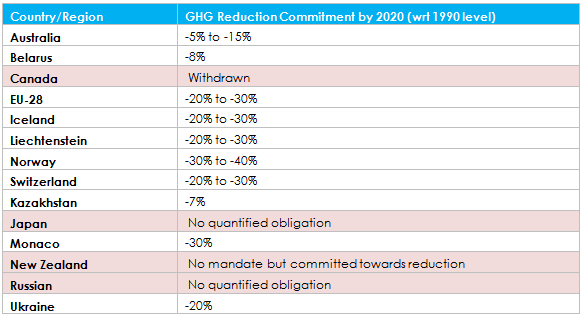
The objective of the first commitment period of the Kyoto Protocol was to reduce the net global emissions to 5% below 1990 level by 2012. The bar was raised to 18% for the second commitment period.

Implementation

Each party is allocated a certain amount of allowances based on their historical emissions. An allowance gives the party the right to emit 1 ton of CO2 or equivalent GHG. The amount of allocated allowance is termed as Assigned Amount Units (AAU).

There are few mechanisms which allow the party to increase its inventory of allowances:
  1. Removal Unit (RMU) on the basis of land use, land-use change and forestry (LULUCF) activities such as reforestation
  2. Emission Reduction Unit (ERU) generated by a Joint Implementation (JI) project
  3. Certified Emission Reduction (CER) generated from a Clean Development Mechanism (CDM) project

Clean Development Mechanism

CDM allows a participating country to earn an extra allowance (called CER) by undertaking a project in a developing country which helps in reducing their CO2 emission by 1 ton.

Joint Implementation

JI allows a participating country to earn an extra allowance (called ERU) by undertaking a project in another participating country which helps in reducing their CO2 emission by 1 ton.

International Emission Trading

In addition to the above mechanisms, one can buy allowances in the open market. An open market is an efficient mechanism to determine the true price of an allowance (a ton of CO2 emitted). Emission Trading allows a party to sell excess allowance to another party which could not curb its emission.

To prevent the parties from overselling their AAU and ending up falling short in meeting their own emissions targets, each party is required to maintain a reserve of allowances in its national registry. This reserve, known as the commitment period reserve, should not drop below 90% of the party's assigned amount.

At the end of the year, there is a true up where the party has to surrender the allowances equivalent to its annual emission. A penalty is imposed if the party fails to possess sufficient number of allowances.

Depending upon the carbon regime, an excess or shortage of allowances can be dealt in the following ways:
  • The excess allowance could be banked to the next period
  • The shortage of allowance could be covered by borrowing it from the next period

Monitoring and Reporting

A system has been set in place for precise recording and reporting of emission data. The adherence of the parties to their commitment is also monitored.

Greenhouse Gases Covered

  • Carbon Dioxide (CO2)
  • Methane (CH4)
  • Nitrous Oxide (N2O)
  • Hydrofluorocarbons (HFC)
  • Perfluorocarbons (PFC)
  • Sulphur Hexafluoride (SF6)
  • Nitrogen Trifluoride (NF3)


EU-Emission Trading Scheme (ETS)

Phase 1(2005 – 2007) & Phase 2 (2008 – 2012)

Phase 1 was a pilot phase that helped EU in setting up the necessary infrastructure to build a new market in Emission Trading also known as Cap and Trade Market. Phase 2 was aligned to the Kyoto Protocol's first commitment period.

The following industries were covered under this scheme:
  1. Power Plants & Utilities
  2. Oil & Gas
  3. Steel and Heavy Industries
  4. Glass & Cement
  5. Paper & Pulp

These industries emit around 45% of the net EU emissions. National Allocation Plan (NAP) was deployed where each member within the EU were allocated allowances based on their historic emission. The member state had their discretion on allocating the allowances to the industries.

The allocation to the industries could be done in either of the two ways:
  1. Free Allocation – The industry would receive the allowances without having to pay for it. The argument against this method is that it could lead to windfall profits.
     
  2. Auction – The industry would have to bid to earn the allowances. This could lead to a hefty increase in the cost to the company, the consequence of which has to be borne by the consumers. The company might lose its competiveness operating in EU’s carbon regime and thereby choose to shift to a country without such mandates. Due to this fear of Carbon Leakage, EU decided to limit the amount of allowances to be allocated by auction to 5% in the first phase and 10% in the second.

The players were not allowed to bank their excess allowances at the end of the first phase. This led everyone to the selling spree, resulting in the nosedive of the price to a few cents (from a peak of 30 Euros).

Phase 3 (2013 – 2020)

There were many lessons learnt from the previous phases which lead to major changes in the third phase. Some of the key features are listed below:
  • National Allocation Plan (NAP) was replaced by an EU wide Harmonized Carbon Regime
  • Full auction for allocating allowances to the power sector
  • 50% of the fund from auctioning to be used to fund Carbon Capture and Storage (CCS) projects
  • Free allocation of allowances for the new entrants (entrants in the power sector do not qualify)
  • A maximum of 5% of the total allowances could be used for New Entrant Reserve
  • A maximum of 50% of the required reduction in GHG emissions can be attained using CDM/JI mechanisms
  • Aviation was added to the list of industries to be covered under the scheme. Allowances equivalent to 97% of 2004-2006 average emission was allocated, 85% of which were allocated freely


Illustration


Participants


The Impact of Kyoto Protocol


The above graphs depict the trend in global CO2 emissions and EU CO2 emissions. We see a sharp decline in EU emissions after 2005, since the implementation of EU-ETS; albeit there is a decline in EU energy consumption as well which can be attributed to the global recession.

From the global perspective, we do not see any downward trend in the emission pattern. The primary reason for this monotonically increasing curve is the rapid expansion of the developing economies – China and India which largely curtails any reduction elsewhere.

This demolishes the basic foundation of the Kyoto Protocol and the Emission Trading Scheme. However this should not be looked upon as a failure. Kyoto Protocol led the industries to factor in the cost of emitting GHG in their balance sheets for the first time. It motivated them to invest in clean technologies sparking innovation in the fields of renewables and CCS. This should be taken as a call for a collaborative international effort with stringent measures to cut down the GHG emissions. The longer we remain irresolute on our actions, higher the cost of mitigating the risk gets.

The clock is ticking and it's too late to be a pessimist.


Bibliography
  1. US Senate
  2. GOV.UK
  3. Intercontinental Exchange (ICE)
  4. The Guardian
  5. Scientific American
  6. Excel Rawdata
  7. EU Member States
  8. UNFCCC - Doha Amendment


Sunday, 12 October 2014

Global Warming - Too Hot to Handle!

Millions of acres of forest cleared due to devastating wild fires. Tens of thousands of lives lost in catastrophic cyclones. Thousands of climate change refugees seeking for asylum. Hundreds of lives lost due to intense heat waves.


One thing is for sure, our climate is changing and it is changing fast. There is one term that tends to associate with all these natural calamities - Global Warming. There are strong indications that Global Warming is happening and it is led by anthropogenic processes.

The concept of Global Warming draws criticism mostly because of the time scale at which it operates. A chilly winter in a town will instinctively lead us to conclude that the theory is dubious. We fail to see the long term picture and the complex behavior of the nature.

Anthropogenic Causes

Fossil Fuels – Coal, Oil and Natural Gas are the foundations of the modern human society. Had it not been for fossil fuels, we would not see the myriad of human innovations around us. But it came at a cost – an imbalance in Carbon Cycle.

Forests of an area about the size of Scotland are destroyed every year [1] for building settlements and farmlands for our inflating population. This again has aggravated the imbalance in the Carbon Cycle.

Carbon Equation

CO2 Released by Natural Processes [2][note] + CO2 Released by Anthropogenic Processes > CO2 Sequestered by Natural Processes
(439 Gt per annum)   (35 Gt per annum)   (450 Gt per annum)

43% of the extra CO2 has accumulated in our atmosphere, 28% in our ocean and 29% on our land [2].

The extra CO2 in ocean has turned it acidic and its pH has decreased by 0.1 [2] since the start of industrial era. This has posed a threatening condition for delicate marine organisms like corals and jellyfish.

The extra CO2 in our atmosphere is responsible for trapping more heat from the sun. Ocean warming dominates the increase in energy stored in the climate system, accounting for more than 90% of the energy accumulated between 1971 and 2010. It is virtually certain that the upper ocean (0-700 m) warmed from 1971 to 2010 [2].

Climate System

Our climate system is an inexorably convoluted system involving complex interactions between atmosphere and ocean.

Some of the factors affecting global temperature are:
  1. Concentration of CO2, CH4 and N2O in our atmosphere
  2. Aerosols, dust particles (due to volcanic activities) and clouds that reflect the sunlight back to space
  3. Solar Climate which is supposed to work in the cycle of 11 years [3]
  4. Ocean circulation cycles like El Nino, La Nina, Pacific Decadal Oscillation, Atlantic Decadal Oscillation

Negative Feedback

The negative feedbacks tend to soften any change in our climate system. For example, higher temperature leads to greater evaporation which in turn increases the amount of cloud in our atmosphere. This results in decreased insolation and thus helps maintain equilibrium [4].

Positive Feedback

On the other hand, positive feedbacks tend to aggravate any change in our climate system.

  1. As the extent of ice sheets in the Arctic and Greenland is decreasing, the amount of sunlight reflected by the Earth’s surface is decreasing. This has resulted in decreased albedo and increased insolation.
     
  2. The appalling rate at which the ice sheets are melting is resulting in the formation of Moulin. Moulin creates a pathway for the melted water on the surface of ice sheet to its bottom. This leads to lubrication of the surface on which ice sheets move. Hence the rate at which ice sheets move towards the sea has increased dramatically [5].


  3. There is an immense amount of CH4 seated deep beneath the Alaskan and Siberian permafrost. As the permafrost are getting exposed due to melting ice sheets, their thawing could lead to emission of far more lethal greenhouse gas [6].

Environmental Repercussions

There have been several research papers on the environmental repercussions due to global warming. The conclusions are based on observations and modelling. Of course, no one can say anything for certain. But, we should regard these conclusions as a pin to break the shell of delusion that some of the critics are living in. In this fragile ecosystem, we must inhibit ourselves from being myopic and closed minded.

  1. As the upper ocean is getting warmer, it creates an appropriate precondition for the inception of cyclones. This could be the reason why we are witnessing high intensity cyclones for last few years.
     
  2. The surge in the sea level driven by thermal expansion and melting of ice sheets has claimed low lying lands and has begotten climate change refugees [7].
     
  3. The number of cold days and nights has decreased and the number of warm days and nights has increased on the global scale [2].
     
  4. Extreme heat waves and cold waves would be more frequent. The recent Polar Vortex in Northern America is one of its examples [2] [note].
     
  5. Due to the increase in moisture availability, the El Nino effect is likely to get intensified at regional level. This may lead to devastating effects on the Pacific coasts [2].
     
  6. A warm and dry condition in forests could be a perfect prerequisite for fire to escalate [8].
     
  7. A warmer environment would provide a preferable condition for mosquitoes and pests to flourish. This is likely to pave a path for Malaria epidemic in future [9].

Couldn't we evolve?

Our planet has never been a constant. But, the natural change in the climate is a very slow process allowing species to adapt to the change. The atmospheric concentration of CO2 now substantially exceeds the highest concentration recorded in ice cores during the past 800,000 years. It is without any doubt that anthropogenic processes have caused changes to our environment that are unprecedented in the past 800,000 years [2].

250 million years ago, our planet was facing similar situation as today. Intense global warming and the positive feedbacks led to a tip-off point in the climate. The abrupt change in the environment didn't allow species to adapt. This came to be known as Permian–Triassic extinction event [10], the greatest mass extinction on our planet.

The species living 250 million years were not intelligent enough to understand the change or possibly do anything to evade it. But, we human beings are different and have enough knowledge and capability to hedge our risks. Shall we not take any responsibility to protect our legacy?

We buy all sorts of insurances - life insurance, car insurance, etc - in our lives. This implies we are investing for precarious events that might unfold in future. So, what makes people question the investment done towards sustainable environment and greener future?

Care About the Planet

Are we doing this to save our planet?

This is absolutely not a quest to save Earth! Our planet doesn't need our care! It is mighty enough to take care of itself. This is about us! This is about the greatest specie that has ever lived on this planet; the specie that cared to be inquisitive; the specie that cared to understand the nature; the specie that cared to think about the future.

Our planet has sustained complex life for last 500 million years. During these 500 million years, our planet has had several catastrophic events leading to tumultuous conditions. Species came, flourished and perished, yet our planet didn't lose its aura. It retained its capability to restore equilibrium and gave opportunity to different set of organisms to flourish.

The giant invertebrate insects ruled the planet 300 million years ago [11]. 100 million years ago, our planet favored the reptiles. The mammals are certainly the blessed ones in the current environmental condition. Who knows which group of animal is next on the list?

Our future is in our hand. If we do not take responsibility, a tip-off point in our climate system would not be a matter of 'if'; it will be a matter of 'when'!


Notes
  1. Including forest fire and volcanic activity (250 Mt per annum) [ref]
  2. The atmospheric current called Jet Stream and the oceanic current called Gulf Stream are the major forces responsible for keeping Northern America and North Western Europe warm. Jet Stream prevents the cold air over the Arctic to come south and Gulf Stream distributes the warm equatorial water to the North Atlantic coasts. Due to the warming Arctic and the loss in temperature differences, the Jet Stream and the Gulf Stream are getting weak and hence breaking the engine that keeps the North Atlantic coasts warm.[ref]
  3. Future Map of Sea Level Rise [ref]
  4. Key takeaways from IPCC AR5

Bibliography
  1. BBC - Power of the Planet
  2. IPCC
  3. NASA
  4. Robert Hazen – The Story of Earth
  5. NASA
  6. United Nations Environment Programme
  7. National Geographic
  8. National Geographic
  9. World Health Organization
  10. National Geographic
  11. BBC - How to Grow a Planet

Images
  1. Polar Bear - Mr Wallpaper
  2. Moulin - NOAA Arctic