Sunday, 28 June 2015

Let There Be Light


The array of transmission lines towering over vast expanse of fields, sometimes over more difficult terrain, are the markers of encroachment of electricity in a countryside life. Their humdrum backdrop during a road-trip has become such a cliché that we often chuck out their presence. Albeit, they are the lifeline of the modern human society and exemplify the long journey electricity takes to reach our homes.

Electricity is used in every aspect of our lives. Its reliability is important to support critical appliances in hospitals, operate machines in industries, and run public services efficiently.


For a country, the penetration of electricity to all households and its reliability is an important parameter that reflects the well-being of its citizens and business friendly environment.


There are several complexities in electricity market:
  1. Lack of Storage - Electricity storage technology is not yet at the scale to be deployed at grid level. Hence, the amount of electricity that is consumed has to be produced at the same instant.
  2. Inelasticity of Demand – In an event of ebbing supply, there is a surge in electricity prices. This does not have any influence over the household end-users who pay a fixed price for electricity. This Iron Curtain between the consumers and suppliers of electricity makes the end-users agnostic to any price change. In such cases, there are mechanisms to ramp up the production to meet the demand.
  3. Congestion – There is a technical limit to the amount of power that a wire can carry. This limits the amount of electricity that can be transmitted from one region to another.
  4. Transmission and Distribution Losses – The electricity that is generated by a power plant is subject to Ohmic Loss during its long journey to the end-users. This implies the power at one end of wire is not equal to the power at the opposite end.

These litany of problems make electricity market very different from other markets. There are mechanisms at place to overcome these hassles. The objective of this article is to provide a basic overview of such mechanisms. We will browse through the technology of electricity infrastructure, participants of electricity markets and the mechanism to ensure supply-demand balance.

Power Generation

Nature has provided us plethora of forms of primary energy – fossil fuels, wind energy, solar energy, etc. In its innate form, primary energy cannot be used to satisfy our needs. It has to be converted to a usable form of energy. The task of converting primary energy to secondary energy, i.e. electricity, is done by a power plant.


The power produced from multiple power plants are pooled together before it makes its long journey to household, businesses or industries. The Power Pool is an essential component of electricity infrastructure because it facilitates economies of scale. A single power producing unit is prone to operational failure. Hence, pooling ensures the security of the system by making it less dependent on a single power plant. It promotes competition which results in lower price and innovation amongst different power plants. The implication of pooling is that a consumer never receives power from a specific power plant.

As electricity demand varies every second, power plants should be able to meet this varying demand. There are certainly technical limitations, on basis of which, the power plants can be classified as:
  1. Baseload Power Plant - A baseload power plant can operate continuously for a long time (years) without shutting down and usually produce power at the order of 100s of MW. Since they cannot shut down or restart at a short notice, they serve the purpose of meeting average minimum demand of electricity. Coal, hydro and nuclear power plants are perfect examples of baseload power plants.
  2. Peaking Power Plant – A peaking power plant is used to meet the variable demand above average minimum demand. These power plants have flexibility to be started at a very short notice. Some of the examples are gas turbines, diesel powered plants and hydroelectric plants.


There are several considerations to be taken into account while balancing demand and supply:
  1. The cost and time required to start up or shut down a power plant. Due to technical limitations, certain power plants cannot be started or shut down frequently.
  2. The time required to increase the power output of a power plant.
  3. The cost required to produce extra MWh of electricity. This is called Marginal Cost and depends on fuel and other operational costs and does not include the sunk, amortization or depreciation costs.


Electrical Technology

The purpose of a power plant is to maintain a voltage difference across the two ends of the wire. This voltage difference incites the flow of electrons which in turn leads to the flow of current. An important point to note here is that the speed at which the current flows is almost equal to the speed of light, whereas the speed of flow of electrons is limited to few meters per second. The movement of electrons creates an electromagnetic field which is responsible for carrying power.

In a single phase 220V 60 Hz AC supply, the Root Mean Square (RMS) value of sinusoidal voltage function is 120V. The real value of the voltage oscillates between +311V to -311V sixty times a second. This variation in power output is extraneous to household applications. However, some industrial equipment involving high power motors or welding are susceptible to such variations and require 3-phase AC connection.

The electricity that comes out of a power plant is 3 phase alternating current. 3 phase AC current is just a superimposition of 3 single sinusoidal voltage functions with the phase difference of 120 degrees. The power output in this case is more even.

We could well have used DC supply where the power output is essentially constant. However, there are other limitations to DC which makes it less viable:
  1. The electricity produced by a power plant is in the form of Alternating Current. Hence, conversion to DC would be an extra step.
  2. DC cannot be stepped up cheaply which is compulsory for avoiding power loss while transmitting it over a long distance.

However, recent developments in High Voltage DC transmission capabilities are turning the tides for DC current.

System Frequency

The frequency of the system is of utmost importance in balancing the supply and demand. It is necessary for the frequency to be maintained at 50 Hz (may differ in some countries) for the electrical system to work coherently. Power generators are designed to operate at a very narrow band of frequency (1% variability) and there are controls to disengage the plant from the grid if the frequency surpasses the safe operational limit. Hence, the frequency beyond the tolerance level may have a knock-on effect and may eventually lead to blackout.


The rate at which the frequency of the system changes due to difference in supply and demand depends on the inertia (net supply and load) of the system.

The frequency of the system is an important parameter that is constantly being monitored by the System Operator (SO).

Electricity Infrastructure

As the power plants are located far away from the residential or industrial region, they have to be transmitted across a long distance. While doing so, transmission losses has to be factored in. To minimize the transmission losses in form of heat in the wires, the voltage is stepped up to 100kV. The transmission line takes the power to substation where electricity from other power plants are pooled together and the voltage is stepped down to 10kV. The bus in the substation re-routes the power to different localities in different directions.

The distribution line carries 3-phase electricity from substation to different localities. The 3-phase electricity is branched out to serve the industries and then tapped out to 3 single-phase lines. The voltage in each single-phase line is stepped down to 220V to meet the household needs.


Market Participants

There are many market participants involved in the electricity market to ensure reliability:
  1. Power Generator
  2. Transmission Owner
  3. Distribution Owner
  4. System Operator
  5. Electricity Retailer
  6. Consumers

Generators submit offers to sell electricity and consumers submit bids to buy electricity. Since, household, commercial and small industries may not have capability to participate in the electricity market, they are represented by the retailers. In many cases, the bids to buy electricity is replaced by load forecast done by the System Operator. System Operator is responsible to balance the demand and supply. The transmission and distribution owners are responsible for maintaining their corresponding infrastructure.


Dispatch and Electricity Market

A day is divided into several dispatch periods. Usually, there are 48 dispatches in a day with each dispatch period lasting for 30min. In an advanced electricity market, the dispatch period could be as low as 5min. The System Operator (SO) forecasts the load during each dispatch period. The power generators then submit their offers on the electricity exchange.

The following example illustrates the mechanism of electricity market:
  1. The UK SO forecasts the load for 1st Jan as 28,659MW during the dispatch period of 00:00 – 00:30 AM. This forecast was done days in advance and the UK electricity exchange (APX) was open to offers from the generators.
     
  2. 31st Dec 2014 12:00:00 (Noon) - As APX is a Day Ahead Market, it closes for all dispatch periods pertaining to 1st Jan.
     
  3. 31st Dec 2014 23:00:00 - The SO prepares for the dispatch period of 1st Jan 2015 00:00 – 00:30 AM. He examines the following offer in the ascending order of offer price:


    It can be concluded that generators A, B, C and D would be contributing 27,000MW and generator E would contribute 1,659MW to meet the demand of 28,659MW. The price of last MWh of electricity used to meet demand is called System Marginal Price (SMP), which is GBP 18/MWh in the above case.
     
  4. 1st Dec 2015 00:00:00 – The corresponding dispatch signals are sent to the respective generators.
     
  5. All the generators are paid SMP for each MWh of electricity they generated during the dispatch period, irrespective of their offer price. The payment of SMP to the generator (and not their offer price) encourages them to post the offer price which reflects their true operational cost of producing electricity. Similarly, each customer is charged SMP for every MWh of electricity consumed.

Balancing Supply and Demand

The forecasted load closely follows the pattern of actual electricity demand. However, it is impossible to exactly meet the demand on second-by-second basis using the forecast model.


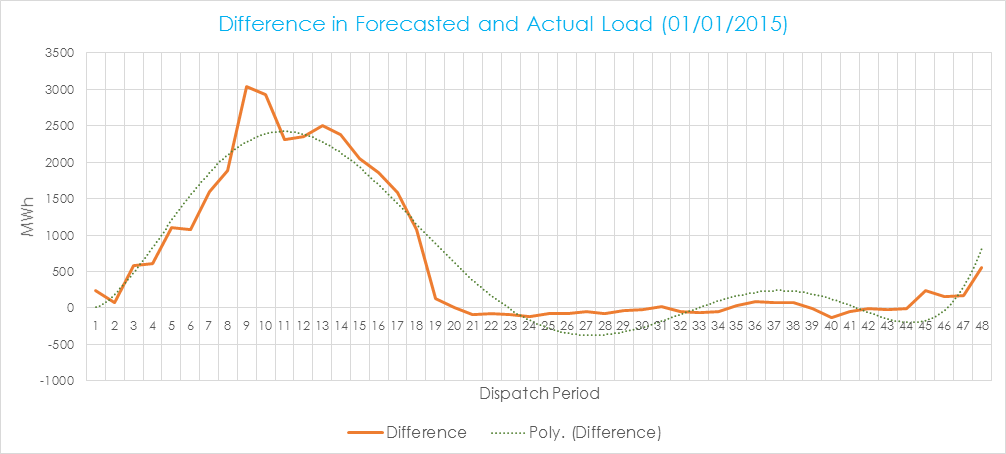
The difference in the actual load and energy procured from the electricity market has to be balanced by different mechanisms. The smoothed out curve (along the difference plot) is met through a Load Following Power Generation Unit. The load followers have synchronous motors which gradually increase or decrease their power output to maintain the frequency of the system.

Whenever there is a surge in demand that cannot be met by the load follower, the SO sends a dispatch signal to a regulator which ramps up its production within 5 seconds and keeps the frequency of the system from falling.

In a nutshell, there are three mechanisms used by SO to meet the demand:
  1. Energy Dispatch
  2. Load Follower
  3. Regulation

In case the energy dispatch is met by renewable energy, the differences are onerous due to the intermittency of wind and solar power generators. To ensure the system security, the amount of regulation needed in such cases are huge.

Contingency and Reserves

There are occasional generator failures which can jeopardize the security of the system. The SO should have prudency in this regard and are mandated to have mechanism at place to deal with such situations. In addition to electricity market, SO also manages the reserve market. Reserves are unused capacity that are required to be brought online in case of any contingency.

  1. Spinning Reserve – These are already running generators that can quickly ramp up their production to meet any unscheduled outage. They are further classified as primary or secondary response depending on their response time (5s to 30s).
  2. Operating Reserve – These are offline generators that can start their production in minutes to meet any unforeseen failure of generating unit. They should be able to sustain their production for upto 2 hours.


Ancillary Services

The Ancillary Service is a very broad term representing services that are essential to maintain grid stability and security. They can be classified into the following categories:
  1. Frequency Control Ancillary Services – The spinning or operating reserves required to meet any unforeseen outage.
  2. Voltage Control Ancillary Services – Frequency is a system constant whereas voltage is a localized parameter which needs to be controlled within the prescribed standards of a particular electrical component. The devices used to control voltages in certain parts of the system fall under ancillary services.
  3. Power Control Ancillary Services – These devices are similar to voltage control and prevents excessive power from reaching a particular electrical component.
  4. System Restart Ancillary Services – Whenever the frequency of the system breaches the tolerance level, the generators may disengage from the grid and shut down. This may lead to a complete or partial blackout. The system restart is not easy because these generators may not have the capability to restart and re-engage with the grid until the frequency normalcy is restored. System Restart Ancillary Services are such generators that help the system to restart and reach the desired frequency range.

Inter-Regional Trade and Congestion

An electricity pool can be comprised of several regions connected by high voltage transmission lines. In case of Nord Pool, it is called interconnectors. Let us take Norway and Sweden as an example of two interconnected regions in the Nord Pool. On 1st Jan 2015 00:00, Sweden's excessive demand for electricity lead to a high price of 300 NOK/MWh, whereas Norway having supply surplus had a low price of 200 NOK/MWh.

In case there was no transmission line connecting Norway to Sweden, the electricity price would have remained as determined in their respective regional power exchange. In case there was no physical limit on amount of power carried by the interconnector, the prices would exactly be the same for Norway and Sweden.

The real case is in the middle of the above two extremes, with a certain physical limit on the interconnector. The new regional prices were re-calculated as below.


Demand Response


We can observe a peak in demand at around 18:00 (36th dispatch period). It is relatively expensive to meet this peak demand as compared to the baseload demand. Peak load leads to congestion and higher transmission losses as well. According to Berkeley National Laboratory, 10% of costs incurred in building and operating electricity infrastructure is to meet demands that occur less than 1% of the time. The study also finds that 5% reduction in peak demand can save upto $2.5billion/year.

In a conventional electricity system, there is negligible demand side participation in electricity market. This demand inelasticity leads to procurement of services that are expensive and environmentally taxing.

The idea of demand response is to build a smart grid where the iron curtain is removed and consumers are exposed to dynamic pricing. The new system will bring elasticity in electricity demand and encourage consumers to either increase their energy efficiency or shift their load from the period of peak demand to the period where prices are low.

Conclusion

The System Operator plays a pivotal role in ensuring the reliability of electricity in our society by:
  1. Forecasting the electricity demand
  2. Analyzing transmission and distribution losses
  3. Determining locational prices and system congestion
  4. Sending dispatch signals to the generation units
  5. Managing ancillary services market to ensure system stability

The mechanism by which the electricity reaches our home is mired in several complexities which is going to increase because of integration of intermittent power generating units to the grid. This intricacy is compounded by the inelasticity of demand. A major revolution in the form of smart grid is required to adhere to our growing demand for electricity. This would require a major investment in electricity infrastructure.

The revolution of shifting away from fossil fuels to renewable energy cannot come without the reinforcement of the electricity infrastructure.


Bibliography
  1. Fundamentals of Power System Economics - Daniel Kirschen and Goran Strbac
  2. AEMO
  3. Nord Pool
  4. Berkeley National Laboratory
  5. Clarke Science Center

Data Sources
  1. National Grid
  2. EIA
  3. World Bank


Sunday, 17 May 2015

Now I am become Death


"Now I am become Death, the destroyer of worlds."

Dr. Robert Oppenheimer knew he had created something far more lethal than Frankenstein. The names he chose were rather very benign - Little Boy and Fat Man. A couple of years later, the Little Boy killed 135,000 people and the Fat Man took 64,000 human lives. It has been 70 years since the world first witnessed the egregious power of the nuclear energy. The display of nuclear power in Hiroshima and Nagasaki left the world in awe that still lingers.

Nuclear force is one of the fundamental forces that exist in the universe. Our understanding of the universe and its origins will be utterly wrong if we do not clearly understand this force. It underlies the energy that gives birth to a star and its solar system. All forms of energy that we can harness are essentially derived from the nuclear energy either released from the Sun (Solar, Wind, Tidal, Fossil Fuels) or the extant Supernova remains that lead to the buildup of radioactive materials in the Earth's crust.

The energy density of a nuclear reaction dwarfs that of any chemical reaction (combustion of fossil fuel) which is usually used to generate electricity. The amount of energy released by 1 kg of Uranium is equivalent to burning 22,000 kg coal or 14,000 kg LNG. All this, without releasing any greenhouse gas. The amount of energy produced in a nuclear reactor can be controlled, thereby making it an ideal candidate for a base-load power plant. On the contrary, the amount of energy produced by a wind or a solar power plant depends on the weather. This acts as a major impediment for a renewable energy power plant to be integrated with the power grid.

As the cheap and reliable electricity produced by fossil fuel is debated against its harmful greenhouse gas emission, so is nuclear energy rebuked for its sinister usage as weapon of mass destruction.

With great power comes great responsibility. The immense amount of power in nuclear energy deserves utmost responsibility indeed.

The following report is a prologue to the upcoming reports on Global Proliferation Regime and Iran Nuclear Deal. Prior to delving into such complex topics, it is important to understand the intersecting area between the technologies used in nuclear power plant and nuclear weapon proliferation. Thus, the objective of the report is to elucidate the fundamentals of nuclear physics, nuclear fuel cycle and the technical knowhow of developing a power plant and a nuclear bomb.

History

The history of nuclear energy begins in 1896 with the discovery of energetic rays coming out of Uranium ore by Henri Becquerel. A couple of years later, Marie and Pierre Curie separated the decay products from Uranium – Radium and Polonium and termed the phenomenon as Radioactivity. The amount of energy released during radioactive decay was later quantified by Albert Einstein in 1905 with his famous equation e=mc2.

The discovery of neutron by James Chadwick was pertinently followed by the idea of nuclear chain reaction by Leo Szilard in 1934. Since the chemistry of nuclear reaction was still unknown, Szilard could only conclude that once a nuclear reaction was triggered by a neutron, the reaction would produce further neutron, leading to a chain reaction.

The nuclear fission was later discovered by Otto Hahn in1938. This was the watershed moment for nuclear physics. The subsequent advancement in nuclear technology changed the dynamics of the world. As Europe plunged into the Second World War in 1939, US president Franklin Roosevelt realized the amplifying risk. He envisaged that it wouldn’t be too long for US to be mired in the disarrayed global conflict. He commissioned the Manhattan Project which would then be responsible to develop the deadliest weapon human beings had ever created.

What Leo Szilard had only envisaged and Otto Hahn could only produce discretely was amalgamated by Dr. Enrico Fermi. Dr. Fermi and his group had initiated the first man made nuclear fission chain reaction. The task of harnessing the destructive power of the nuclear reaction was then taken over by Dr. Robert Oppenheimer in 1943.

Radiation

There are two types of radiations:
  1. Nuclear Radiation - The energy released during a nuclear fusion or fission reaction is accompanied by the release of Nuclear Radiation. There are four common types of nuclear radiation:
    • Alpha – Chemically, a Helium nucleus that is slow moving and bulky, thereby making it highly ionizing but least penetrative. In context of external exposure, it is the least harmful. However, when inhaled, it can cause severe damage.
    • Beta – Chemically, an electron, it is released along with a proton when a neutron splits apart during a nuclear reaction. As they are very small, they can penetrate through clothes and skin and are believed to cause substantial damage.
    • Positron – It is released when a proton mutates to neutron during a nuclear reaction.
    • Gamma – High energy photons that are considered to be the most dangerous of all forms of radiations because of their high penetration power.
       
  2. Thermal Radiation – According to Kirchhoff's first law of radiation, every object above absolute zero emits radiation at all wavelengths. Wein's Displacement Law describes the relationship between the temperature of the object and the wavelength of the radiation that the object emits the strongest. Higher the temperature of the object, the low wavelength radiations like Gamma and X-Ray emissions will be stronger. Depending on their wavelengths, the thermal radiation could be classified as follows (in the order of increasing wavelength):
    • Gamma
    • X-Ray
    • Ultraviolet
    • Visible
    • Infrared
    • Microwaves
    • Radio waves

Although it is not very clear how radiation affects our cells, it is believed to be due to their ionization effect. As the radiation travels through a medium or hits an atom, it makes them electrically charged. This process of ionization can have adverse biological effects.

Measuring Radiation

There are many units to measure the radiation depending on the aspect of measurement:


The effective dose of radiation is detected using Geiger Counter which uses the amount of sample gas ionized as a measure of radiation in the environment. To have a perspective of the dose of radiation that we continuously experience, here are few numbers:
  1. Natural radiation = 0.3 rem per year
  2. Acceptable safe dose = 5 rem per year
  3. Safety limit = 25 rem per year
  4. Fukushima Blowout = 0.8 per hour

However, due to certain events, one may have to encounter high dose on spur of the moment.
  1. Chest X-Ray = 0.01 rem per dose
  2. Safety limit = 10 rem per dose
  3. Radiation Sickness = 100 rem per dose
  4. Death = 500 rem per dose

There is no clear consensus on the safe limit of radiation. The biological effect it has is entirely based on probability. 1% of all the reported cancer is due to natural radiation (0.3 rem per year). A small but continuous dose of radiation may be harmful. A high dose of radiation is very likely to create damage. Yet, Tsutomu Yamaguchi is known to survive both the Hiroshima and Nagasaki bombings, even after being within 3km from ground zero at both the occasions.

Radioactivity

The nucleus of an atom consists of protons and neutrons. There are two opposing forces acting inside the nucleus – the strong attractive nuclear force and the repulsive electrostatic force amongst positively charged protons. The presence of neutron is to dilute the repulsive force and keep the nucleus stable.The number of neutrons required to serve this purpose depends on the number of protons in the atom (or the Atomic Number). Higher atomic number requires greater neutron-to-proton ratio to keep the nucleus stable.

Isotopes are elements with same Atomic Numbers (number of protons) but different Atomic Mass (number of protons and neutrons). The chemistry of an element is amply characterized by the number of electrons (which is equal to the number of protons or the Atomic Number) in its atoms. Hence, isotopes have similar chemical properties but different physical properties.

An unstable nucleus disintegrates into a more stable one through the process of nuclear fission or decay. During this process, different kinds of radiations are released. The net mass of final products of any nuclear fission reaction is always lesser than that of the original reactant. This difference in mass is converted to energy which is quantified by e=mc2 (where c is the speed of light). The released energy is manifested in the form of kinetic energy of the nuclear fission products. As these products collide amongst themselves and the wall of the container, this kinetic energy converts to thermal energy.

There are many unstable (relatively) nucleus found in nature. One of them is U238. It slowly but continuously undergoes the process of nuclear fission. The half-life of U238 is 4.5 billion years. This means that if we have 1kg of U238 today, we will be left with 0.5kg of U238 after 4.5 billion years. The other half would have undergone nuclear fission. The amount of power produced during natural nuclear fission of U238 is 0.1 W/ton, too low to experience it in the form of heat.

Natural Fission and Artificial Fission

The difference between natural nuclear fission and artificial nuclear fission lies in the role of neutrons. A naturally radioactive nucleus like U238 have a very long half-life. They are directly not useful to us to extract energy.

Artificial nuclear fission harnesses the criticality of neutron-to-proton ratio which is essential for the stability of nucleus. A neutron is directed towards the nucleus of a relatively stable isotope, which then fuses with its nucleus and produces a Radioisotope with unstable neutron-to-proton ratio and a shorter half-life. An isotope with shorter half-life will disintegrate rapidly and produce significant amount of energy.

As neutron is electrically neutral and easier to produce, it serves as a better candidate to disrupt the imbalance in the neutron-to-proton ratio.

Trigger for Nuclear Fission

The probability that a neutron induced fission of a nucleus will take place depends on the Nuclear Cross Section. It could be imagined as a sphere around the nucleus through which the neutron must pass to be captured by the nucleus. It largely depends on two factors:
  1. Type of radioisotope - Isotope with odd number of neutrons like U235 are relatively unstable and thus have a larger nuclear cross section.
  2. Type of neutron – As precision to hit the target decreases with the speed, higher speed of the neutron leads to a smaller nuclear cross section.

The energy possessed by the neutron and its probability to hit the nucleus of a radioisotope is crucial for any nuclear fission reaction. Based on these factors, the neutron could fall into either of these categories:
  1. Fast Neutrons - The high energy (~2MeV) neutron released just after a radioactive decay. Due to their high speed (10% of the speed of light), the probability of striking a nucleus is low.
  2. Thermal Neutrons – The fast neutrons lose their speed (~2 km/s) and energy (~0.025 eV) due to collisions or presence of moderator (like water or graphite). As these neutrons attain the thermal equilibrium with the medium surrounding them, they are called thermal neutrons. The thermal neutrons have higher probability of triggering another fission.

The radioisotopes that can undergo nuclear fission are Fissionable. They are classified as follows based on their ability to sustain chain reaction:
  1. Fissile – They can sustain chain fission reaction in the presence of either thermal neutrons or fast neutrons. However, the probability reduces drastically in the case of fast neutrons due to shrunk nuclear cross section. The isotopes with odd number of neutrons are usually fissile. Eg: U235
  2. Fertile – They can undergo fission only after they have been transmuted to a Fissile material. The isotopes with even number of neutrons are usually non-fissile. Eg: U238, Th232

In a nutshell, the combination of the following two triggers is essential to incite any fission reaction:
  1. Excitation energy required by the nucleus to undergo fission (fissile or fertile nucleus)
  2. The probability of neutron to be captured by the nucleus (fast or thermal neutron)


Nuclear Reaction

Whenever a neutron hits a nucleus, the nucleus excites into a higher energy mode. It can release its energy in either of the two ways:
  1. Nuclear Fission – When the excited nucleus releases its energy by breaking itself apart, it is said to undergo fission. Eg:

    U235 + n -> U236 -> Ba144 + Kr90 + 2n + 200 MeV

    Here, U235 upon capture of neutron converts into excited U236. The nucleus of U236 being in excited state, disintegrates into Ba144 and Kr90, releasing 200 MeV energy to attain a stable configuration. However, this is only one of the many probable products. The excited U236 could also undergo the following reaction:

    U235 + n -> U236 -> Zr94 + Te139 + 3n + 197 MeV

    The primary fission products can undergo secondary fission and this may continue to various levels. 6% of heat generated in a nuclear power plants come from subsequent fission of primary fission products.
     
  2. Nuclear Decay – When the excited nucleus returns to a stable state by the release of nuclear radiations without undergoing fission. Eg:

    U235 + n -> U236 -> U236 + Gamma

    Here, the excited U236 doesn’t undergo fission. It rather decays into stable U236 configuration by emitting Gamma radiation. U236 is non-fissionable and accumulates in the reactor as nuclear waste.

    This is also the process by which a fertile nucleus transmutes into a fissile nucleus.

    U238 (fertile) + n-> U239 -> Np239 + Beta -> Pu239 (fissile) + Beta

    Here, U238 upon capture of neutron doesn’t undergo fission. It rather undergoes decay to Pu239 by the release of two Beta particles. In a Uranium based nuclear reactor, this results in the buildup of Transuranics. Transuranics are actinides heavier than Uranium. Some Transuranics like Pu239 and Pu241 are fissile like U235, and can undergo fission after a neutron capture. However, some of them do not undergo fission and stay in the reactor as spent fuel.

Conditions for Chain Reaction

Inciting a fission reaction is an arduous task. However, sustaining a chain fission reaction is even more arduous. The fission of U235 may release 2 to 7 neutrons, with an average of 2.4 neutrons. These neutrons may have different fates:
  1. Leak away from the reactor without interacting with anything
  2. Scavenged by neutron poisons like Boron and Hafnium (Control Rods)
  3. Absorbed by the moderating medium present (Light Water or Graphite)
  4. Captured by a nucleus without resulting in its fission (U238 to Transuranics)
  5. Incite another fission reaction

Neutron economy is essential for sustaining a chain reaction. A moderating medium of Light Water absorbs too many neutrons to incite another reaction. Hence, a Light Water reactor needs enriched Uranium to increase the probability of neutron to hit U235 nucleus. On the other hand, Heavy Water doesn’t have too much affinity towards neutrons. Hence, Heavy Water doesn’t really need enriched Uranium to sustain chain reaction.

As stated earlier, U235 produces 2.4 neutrons per fission on an average. The average number of neutrons that can incite another fission reaction is defined as k-effective, which depends on the design of the reactor. The state of the reactor is defined by its k-effective:
  1. K-effective = 1 is the critical state where 1 neutron per fission (on an average) incites another fission reaction. The power produced in this state is steady. A minimum amount (Critical Mass) of fissile material is compulsory to attain this state.
  2. K-effective < 1 is the subcritical state where chain reaction is about to subside. The power produced in this state is decreasing.
  3. K-effective > 1 is the supercritical state. The power produced in this state is increasing.

99% of the neutrons are released by the primary fission reaction. Once they are released, they can incite another fission reaction within microseconds. They are called Prompt Neutrons. However, the fission products may still have the potential to undergo secondary and tertiary fission. The remaining 1% of neutrons are release by these fissions and the time lag depends on the half-life of the fission products. These neutrons are called Delayed Neutrons.

The control on the rate of chain reaction depends on the delayed neutrons. If all the neutrons inciting the subsequent fission reaction in the reactor were prompt neutrons, it would virtually lead to instantaneous and uncontrollable release of energy. The fact that there are delayed neutrons in any nuclear fission enables us to control the rate of the reaction. The emplacement of control rods inside the reactor scavenges the neutrons from the reactor and bring down the state to subcritical. On the other hand, withdrawal of the control rods will revert the system to critical or supercritical state.

Nuclear Fuel Cycle

The extraction of naturally occurring Uranium to the fabrication of fuel rods and its eventual disposal is an intricate process. Since a large part of nuclear fuel cycle for civilian use and proliferation use is common, the process is very sensitive and is monitored by international watchdogs like IAEA.


Enrichment

Enrichment Plants use gaseous UF6 to enrich natural Uranium from 0.7% U235 to ~5% U235 to be used in a Light Water Reactor. Most of the facilities exploit the difference in their mass to separate them. Some of the different types of enrichment plants are:
  1. Calutron was the first enrichment facility to be developed. This was used to produce weapon grade Uranium for Hiroshima bombings. It was based on the principle of mass spectrometry – ionizing the Uranium and then utilizing the magnetic field to separate U235.
  2. Gas Diffusion Plant uses Pressurized UF6 in a Teflon container to pass through Nickel pores. U235 being lighter, moves faster and can be collected at the low pressure side of the pore. The process is repeated several times to attain the desired level of enrichment. This is a very energy intensive process and is almost obsolete now.
  3. Gas Centrifuges uses UF6 in steel cylinders spinning at high speed in partial vacuum. U235 being lighter, is separated at the inner walls of the centrifuge. Many centrifuges are connected in cascade and the process is repeated several times to attain the desired level of enrichment. Gas centrifuges are 40 times more energy efficient than similar Gas Diffusion plants. They are the most commonly used facilities for enrichment.
  4. Aerodynamic Separator uses high velocity pump with sharp bends to separate lighter U235.
  5. Chemical Exchanger uses the difference in chemical properties of U235 and U238. This is not yet ready to be used at a commercial level.

The capacity of Enrichment Plants are defined by the term called Separative Working Units (SWU). It can be defined as the amount of effort required to produce a certain amount of Uranium enriched to a certain level. It depends on the following factors:
  1. Desired level of enrichment (5% U235)
  2. Enrichment level of feed Uranium (0.7% U235)
  3. Enrichment level of depleted Uranium (0.3% U235)

If a facility produces 1 kg of 5% U235 from 0.7% U235 feed and leaves behind 0.25% U235 depleted Uranium, it has the capacity of 8 SWU. An average Gas Centrifuge has the capacity to produce at 1SWU per year. This means that 1 gas centrifuge can produce 1 kg of 5% U235 enriched Uranium in 1 year. An enrichment plant can have more than 1000 gas centrifuges.

Significant Quantity (SQ) is the measure of the quantity of weapon grade Uranium. If a facility has to produce 27 kg of 90% U235 with similar feed and depleted Uranium, it would require the capacity of 5000 SWU. Hence, 1 SQ requires 5000 SWU capacity of enrichment facilities. If a country has 1000 gas centrifuges, each producing at 1 SWU per year, the net capacity of the country would be 1000 SWU per year. That country would take 5 years to have the capacity of 5000 SWU, good enough to produce 1 SQ or 1 nuclear bomb. The amount of time required by a country to develop 1 SQ is also called the Breakout Time. The breakout time is an important parameter in the ongoing Iran Nuclear Deal.

Nuclear Power Plants

A nuclear power plant comprises of the following:
  1. Moderator is required to generate thermal neutrons necessary for inciting and sustaining the nuclear chain reaction. Examples: Water, Graphite
  2. Control Rods are used to control the neutron economy and thereby the power output in the reactor. Examples: Boron, Hafnium
  3. Coolant is used to transfer the heat from the reactor to an appropriate channel. Examples: Water
  4. Turbine converts the mechanical energy from steam to electrical energy.

The nuclear reactor for commercial use are designed to have negative temperature coefficient. This implies a decreasing rate of reaction with increasing temperature. The Chernobyl nuclear plant which experienced a blowout in 1986 had a positive temperature coefficient. As this plays an important role in the safety of the plant, there are international mandates on adhering to strict temperature coefficient.

The common types of nuclear power plants are discussed below:
  1. Light Water Reactor (LWR) – It uses light water as the moderator to produce thermal neutrons. Since light water has slight affinity towards neutrons, it disrupts the neutron economy in the reactor. To increase the probability of the neutron to hit a fissile nucleus, the concentration of U235 has to be increase to 5%. Once the chain reaction is initiated, the heat produced from the reaction is used to convert water to steam which in turn is used to run the turbines. LWR can be of two types:
    • Boiling Water Reactor (BWR) – The coolant water is kept at normal pressure and since it is in direct contact with the reactor core, it converts to steam. This steam is directly used to run the turbines.
    • Pressurized Water Reactor (PWR) – The coolant water in the primary circuit is kept at high pressure and although it is in direct contact with the reactor core, it is prevented from converting to steam. The heat exchanger transfers the heat from the primary circuit to the secondary circuit containing stream of water. The water in secondary circuit converts to steam which is used to run the turbines.
  2. Heavy Water Reactor (HWR) – It uses heavy water as the moderator to produce thermal neutrons. Since heavy water has low affinity towards neutron, the neutrons released in fission has higher probability of hitting another fissile nucleus rather than being absorbed by the moderator. Hence, HWR can use Natural Uranium with 0.7% U235 as its fuel. The design of HWR permits its refueling even while the power plant is online. On the other hand, it produces pure form of Pu239 that can be have proliferation consequences.
  3. Fast Breeder Reactor (FBR) – It uses fast neutrons to incite the nuclear fission and hence does not need any moderator. Tit uses Helium or Liquid Sodium as coolant because they have minimal moderating attributes. The nuclear fuel in both HWR and FBR comprises mostly of fertile material. The average number of fissile nuclei created per fission event is called conversion ratio. This ratio is always less than 1 for HWR or LWR. For FBR, the ratio can be greater than 1. Hence, their performance is much more efficient than a similar HWR or LWR. The reason for this is the absence of moderator and the role of Pu239 as primary fissile material (which produces 25% more neutrons than U235). They also have a strong negative temperature coefficient. Another great advantage of FBR is its capability to burn Transuranics which are usually treated as Spent Fuel and sent for disposal.
  4. Molten Salt Reactor (MSR) - There is a growing interest in the use of Thorium (Th232) as nuclear fuel. Thorium is more abundant than Uranium but Th232 is just 10% as fertile as U238. This restricts its usage in LWR, HWR or FBR. Albeit, the MSR is in design phase to harness the fissionability of Th232. The concept is based on the usage of molten mixture of Uranium and Thorium Fluoride salts, which acts both as the fuel and coolant.

The buildup of fission products and Transuranics in the reactor cause lead to additional neutron absorption. The fuel life can be extended by the use if poisons like Gadolinium which compensates for the absorbed neutrons. After two to three years of operation, the disruption in neutron economy dictates the replacement of the fuel. The reactor core is then dismantled and replenished with fresh fuel.

The used fuel have long half-life and are very radioactive. As the used fuel comprises primarily of Uranium and Plutonium, it is reprocessed to form Mixed Oxide which can again be used as fuel.

Nuclear Weapons

The most important aspect of Nuclear Weapon Design is the state of Prompt Criticality. In a nutshell, it is the state where 1 neutron on an average from primary fission (prompt neutrons) of U235 or Pu239 incites the next fission in the chain reaction. If the design led the state of the bomb to be in supercritical, the rate of reaction would grow exponentially. In a matter of milliseconds, the core would disintegrate into smaller fragments by weak and short chain reaction known as Fizzle. This would not allow the core to be integrated within one chain reaction which is compulsory to produce very high temperature required to do the damage.

The preliminary task in building a nuclear bomb is to acquire the fissile materials which can be used as the fuel. There are two approaches:
  1. Weapon Grade Uranium (HEU), 90% U235 – This can be obtained from an enrichment facility.
  2. Weapon Grade Plutonium, 90% Pu239 – In a thermal reactor core (LWR or HWR), U238 transmutes to Pu239. During early days of operation, this Plutonium is not contaminated with Pu240, which when used in nuclear bomb can lead to fizzle. HWR produces a purer form of Pu239 than a LWR. Hence, the reactor can be brought offline after two months of operation, and Pu239 can be retrieved for developing the bomb.

The second task is to keep the fuel in sub-critical state prior to detonation.

The Manhattan Project came up with three nuclear bombs, all different in the technology they used:
  1. Little Boy – It used 85% Enriched U235 as the fuel. It was based on the Gun Assembly design. The idea in the Gun Assembly design is to keep several sub-critical masses of fuel separated. A detonation is used to fuse the masses together to form a single mass greater than the critical mass required to sustain chain reaction. A jet of neutron would immediately incite a chain reaction and lead to near-instantaneous release of huge amount of heat.
  2. Thin Man – It used the same design as Little Boy, but proposed the use of Pu239 as fuel. Its development was aborted after it was deduced that the design may lead to fizzle.
  3. Fat Man – As Pu239 is more fissile than U235, it cannot be used in the same design as U235. It rather used an Implosion Assembly where chemical explosives are used to create shock waves which compress the fuel to super-criticality. Once the super-critical mass is available, a jet of neutron would be sufficient to do the damage.

85% of the energy released by the fission reaction in the bomb is released instantaneously as thermal energy. The remaining 15% is in the form of radiations – both thermal and nuclear. As the temperature exceeds 1000°C, the thermal radiation may be strong near X-Rays and Gamma rays. The nuclear radiation in the form of alpha, beta and gamma particles have widespread consequences. The radioactive decay of the fission products with long half-lives have long lasting repercussions.

The Grey Area

The Nuclear Non Proliferation Treaty (NPT) is built upon three pillars:
  1. Right to use nuclear energy for peaceful purpose
  2. Non-proliferation of nuclear weapons
  3. Disarmament by nuclear weapon equipped countries

However, there is always an area of intersection between the technology used to harness nuclear energy for peaceful civilian use and the technology used to create nuclear weapon. In past, the facilities which were supposed to generate electricity from nuclear energy has been used clandestinely to accumulate weapon grade fissile material.

The below flowchart demonstrates the grey area in the nuclear fuel cycle:


Summary

The objective of this report is to provide a basic overview of nuclear fuel cycle and the grey area in the technology used to develop a nuclear power plant and the technology used to develop a nuclear weapon.

It started with the history of nuclear physics and examined the phenomenon of radioactivity and its risk. It moved on to explain the nuclear fission reaction, chain reaction and the conditions necessary to attain them. With the understanding of basic nuclear physics, it elucidated the nuclear fuel cycle, nuclear power plants and nuclear weapons design.

This report will be used as a reference in the series of upcoming articles on nuclear energy policy – NPT Regime, Iran Nuclear Deal and the Indian nuclear policy.


Bibliography
  1. World Nuclear Association
  2. Vanderbilt University
  3. Council on Foreign Relations
  4. Foreign Policy
  5. Depleted Cranium
  6. Areva
  7. Live Science
  8. Princeton University


Sunday, 8 March 2015

India: The Story of Coal

Coal is the backbone of India's energy needs. 55% of the net primary energy and 68% of the electricity generation is fuelled by coal. Given its abundance and cheapness, it is poised to be the dominant energy source for decades to come.


India is the third largest producer and consumer of coal in the world. However, the amount of coal used by India is puny in contrast to the voracious Chinese demand.


Coal is primarily used for electricity generation. However, it is also an essential fuel source in the manufacturing sectors like steel, cement and glass.


More than 80% of Indian coal is mined by Coal India Limited (CIL) which is struggling to quench the Indian coal demand. The inefficiency of CIL's operation and frequent supply disruption are the major reasons of India's thermal power plant running on inexorably low Plant Load Factor and their growing dependence on the imported coal.


The Import Burden

In India, 68% of electricity is generated using coal. However, due to the scarcity of thermal coal and chokepoints in the coal linkages, many power plants experience a shortage of fuel. Thus, India relies on the import of thermal coal to keep its power plants running.


As the imported coal is expensive as compared to domestically produced coal, it imposes a huge burden on India's current account.


Coalgate

The coal auction is definitely the hot potato in the Indian coal sector. The coal-gate scam revealed the slackness and corruption in the Indian bureaucracy. The level of ineffectiveness was the major impediment in the development of the coal sector and gave rise to coal-mafia. With the swift action of Supreme Court of India and the new Coal Ministry's design of an efficient auction system, the coal sector now seems to be clear of major hassles.


Until 1993, the Indian coal sector was primarily in the hands of Coal India Limited (CIL), a government run company since 1973. Any consumer of coal had to have a contractual agreement with CIL regarding any purchase of coal. The government realized the inefficiency of this monopoly and decided to invite coal consumers for mining of coal for their end-use in 1992. A Screening Committee was setup to facilitate the allocation of coal blocks to private players for mining. The preference was given to the power and steel sector companies.

The Screening Committee was responsible for the allocation of coal blocks from 1993-2008. The criteria set for the recommendation by the Screening Committee was merely the financial and technical expertise of the companies that showed their interest in the blocks. The selection process was non-transparent and the recommended company had to pay a nominal fee to snap the deal. Clearly, this methodology would have involved a lot of corruption and nepotism. The companies often used to end up with surfeited reserve than they would require for their end use. The cheapness of the deal also led the companies to buy the blocks and just “squat” over them. This approach aggravated by the inefficiency of CIL was reflected in dwindling Indian coal production and spurring imports.

The Comptroller and Auditor General of India (CAG) issued a report in March 2012 accusing the Government of India for inefficient allocation of natural resources leading to a loss of $33 billion in unrealized revenues and windfall profits to the private players. With the UPA-II already drowned in a glut of corruption scams, this was just another blow. The opposition party and the public outrage resulted in a Central Bureau of Investigation probe into the allegations. A Public Interest Litigation was filed in the Supreme Court against the allocation of the coal blocks on ground of illegality and public interest.

The Supreme Court in its final decision in September 2014 rendered 214 coal blocks out of 218 blocks under investigation (allocated by the Screening Committee from 1993-2008) as illegal.


The four operational blocks were relieved from the austere decision by the apex court because they were either won by competitive bidding or belonged to non-Joint Venture Public Sector Undertaking.
  1. Moher, MP owned by Reliance Power for Sasan Ultra Mega Power Project (UMPP) (allocated by competitive bidding)
  2. Moher Amlori, MP owned by Reliance Power for Sasan UMPP (allocated by competitive bidding)
  3. Pakri Barwadih, Jharkhand owned by NTPC (non-JV PSU)
  4. Tasra, Jharkhand owned by SAIL (non-JV PSU)
The 42 operational blocks that have been rendered illegal are allowed to continue producing until 31st March, 2015. However, they are required to pay Rs 295/T retrospectively for all coal mined since 1993. They are also required to pay an additional levy of Rs 295/T on the coal that will be extracted until 31st March, 2015.


By 31st March 2015, the coal blocks are ought to be allocated to companies through competitive bidding. In case a block could not be allocated to any party, its operation will be taken over by CIL.

Understanding the Coal Auction Process

Since the licenses of the 214 coal blocks have been cancelled by the Supreme Court, the new coal auction process is designed to allocate the coal blocks to the new players.

Some of the key points regarding the players of the auction process are:
  1. The PSUs (like SAIL, NTPC) consuming coal in any form will be given preference for the new allocation of the coal blocks.
  2. The private companies bidding for the coal blocks should be the end-users of the similar variety of coal. This includes the Iron, Steel, Power, Cement and Coal Washeries companies.
  3. The new allotte of the coal blocks can use the mined coal for any of its plants engaged in the similar end-use.
  4. The company will be eligible to bid only if the coal extractable per year from the mine is below 150% of the annual requirement of the end use plant. The small companies are given provision to form JVs.
Depending upon the sunk cost incurred by the companies on their end-use plants, they are segregated into different schedules.


The auction process for the regulated sectors (like power) and unregulated sectors (like steel) are different. It is imminent that the cost of coal to the companies will increase as a result of auction process. The reverse auction is designed to make sure the higher cost of fuel is not passed onto the end-users of the regulated sector.


A two stage bidding process has been designed under which the bidders will be required to submit the technical and financial bids at the respective stages.


The figures of bid prices from the ongoing auction are as follows:


The financial terms laid down for the winner of the blocks are:
  1. The bid price in Rs/T at which the block is won will be applicable for the base year, with a yearly rise linked to a reference index.
  2. Upfront payment of 10% of the intrinsic value of the mine calculated using Discounted Cash Flow (DCF).
  3. 14% royalty to be paid on an annual basis.
  4. A bank guarantee totaling the equivalent of the value of coal at peak production.
  5. A performance security (Minimum Work Program) would require the company to achieve specified milestone within stipulated timeframe.
  6. If the company produces more coal than it actually requires, it will be sold to CIL at a notified price.
The handover from the old allotte to the new owner of the mine will have following characteristics:
  1. The old allotte can sell the land and other immovable infrastructure to the new allotte at the original sale amount with 12% simple interest from the date of purchase.
  2. The old allotte can also sell the movable infrastructure, but in case the new allotte is not willing to buy them, it has to be removed.
  3. The liability of the old allotte cannot be transferred to the new allotte.
The captive power plants have been very aggressive in their bids, beyond the expectation of the analysts. The reason is they risk losing access to the close and cheap coal blocks for their end use.

India has ~20 GW of imported coal based thermal power plants. Due to the rising costs of the imported coal, the auction is their opportunity of coming out of quagmire.

The power producers without coal linkages are also allowed to participate in the auction.

"Generators without PPAs have been in a dilemma for some time. This was because states are unlikely to enter into PPAs with generators that do not have coal linkage and Coal India would refuse to give linkage to generators without PPAs. We have tried to correct the situation by allowing such generators to enter into the auction fray." – Coal Ministry

According to Barclays, the auction of 101 coal blocks will generate an annual revenue of US$3.7bn in addition to US$5.7bn of upfront payment (including royalty spread over the first year) to the states. This will be a significant jackpot for the four states - Jharkhand, Chhattisgarh, Orissa and West Bengal - where almost all the coal blocks are concentrated.

Modi-fied

India's Energy Minister, Piyush Goyal recently announced ostensibly that India will be bringing its coal imports to a complete halt in the next 2-3 years. This is an ambitious statement that requires instilling vigor in its coal infrastructure. Wood Mackenzie predicts that India will be responsible for 40% of the 123 MT rise in the global coal trade. The plethora of upcoming UMPP projects which are obligated to secure supplementary supply on the international market clearly indicates that the coal import is not going to stop anytime soon.

The ministry has asked CIL to double its coal output to 1 billion metric tonnes by 2020. The Coal Ministry has sought intervention by the Railway Ministry to hasten up the three railway linkage project which was due to be completed in 2005. The completion of this project would accrete the Coal India output by 300 million tonnes per year. However, Reuters impugns this blatant assertion by the ministry.

To keep the expected fiscal deficit to 4.1% of GDP on track, the government has sought for disinvestments in PSUs to generate revenue. The divestment in Coal India in February 2015 generated Rs 24,557 crore to the Indian government.

The coal auction has helped the state and central government to raise substantial revenue which could be used in improving the rickety infrastructure. The conditions of Minimum Work Program and relinquishment of excess reserve embedded within the new block allocation regime will ensure a surge in coal production. The reverse bidding for the power companies is designed to bring down the electricity tariff paid by the end user.

These are sanguine indications to reinforce the coal sector given the fact that CIL is unable to ramp up its production which is at par with the nation's growing demand for coal.

The 2015 budget has increased the railway freight rate and doubled the duty on coal to Rs 200/ton. Although the decision would be chafing for the power companies, the government's intention for the thermal power companies is to increase their efficiency and move towards alternative fuel. We should hope the revenue generated from excess duty is directed towards the development of clean energy.

The Future and Social Cost of Coal

According to World Resources Institute (WRI), 1199 new coal fired power plants are being proposed to be set up around the world, with 76% of this coming from India and China alone.


This is clearly not aligned with the IPCC's warning on inhibiting the coal usage. Coal is the dirtiest of all fuels known to us, not only significantly contributing to the global warming by releasing greenhouse gases, but also degrading the air by releasing mercury and other particulates.

According to WHO report, 13 Indian cities are amongst the top 20 cities with worst air quality. Another research by Centre for Science and Environment says the Indian coal based thermal power plants are the most inefficient and polluting in the world.


GlobalData envisages the incipience of Clean Coal Technology implementation in Indian Thermal Power Plants through the Ultra Mega Power Projects (UMPP). They expect the CCT technology to produce 103 GW of thermal power by 2025.


To make sure that India's growth is sustainable and doesn't vex its environmental efforts and resident's well-being, it should invest in improving the technology, internalizing the environmental costs and innovating in the fields of Carbon Capture and Sequestration (CCS). The improving ties with the US and its expertise in Clean Coal Technology should be employed to move forward in this direction.


Bibliography
  1. Barclays Research
  2. Bloomberg
  3. Reuters
  4. Reuters
  5. Wood Mackenzie
  6. Indian Express
  7. Financial Express
  8. The Hindu

Data Sources
  1. World Bank
  2. BP
  3. EIA
  4. Barclays
  5. WRI
  6. Platts