Sunday, 14 December 2014

Kyoto Protocol & Emission Trading

Since the inception of the Industrial Revolution in the late eighteenth century, our society has undergone drastic changes. The advent of manufacturing industries, construction business and transportation has been emblematic to the human development. These changes would not have been possible without the fossil fuels. The countries that identified the true potential of the fossil fuels and developed their ability to harness energy from them, climbed up the ladder of economic development.

We are now beginning to identify the true repercussions of exploitation of the natural resources and the imbalance it creates in our fragile ecosystem. The recent comprehensive report published by Intergovernmental Panel on Climate Change (IPCC) points out the impact of climate change and the cost of a stymied environmental policy.

Some of the poignant consequences that are elucidated in the report are:
  • The requirement to build necessary infrastructure to adapt ourselves to extreme climate
  • loss of land due to increased sea level
  • decline in marine resources
  • vagaries in weather pattern leading to tumultuous crop output


Kyoto Protocol

Kyoto had been the capital of Japan from 1180-1868

Kyoto Protocol is a set of binding obligations set up by the United Nations Framework Convention on Climate Change (UNFCCC) upon industrialized nations to curb their greenhouse gas (GHG) emissions. UNFCCC recognizes that the current level of GHG is primarily due to the industrial activities that the now-developed countries undertook for their development in the past couple of centuries. The developed countries bear the heavier burden under the principle of common but differentiated responsibilities.

The Kyoto Protocol was adopted in Kyoto, Japan, on 11 December 1997 and entered into force on 16 February 2005. It had set two commitment periods for its member countries:
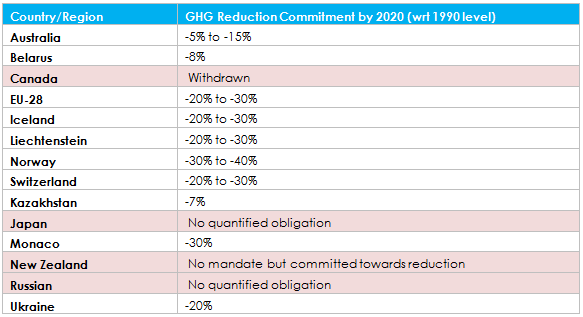
  1. First Commitment Period – 1st January 2008 to 31st December 2012
  2. Second Commitment Period – 1st January 2013 to 31st December 2020

Objective

The objective of Kyoto Protocol and UNFCCC is to stabilize greenhouse gas concentrations at a level that would prevent dangerous anthropogenic interference with the climate system. It states that such a level should be achieved within a time-frame sufficient to allow ecosystems to adapt naturally to climate change, to ensure that food production is not threatened, and to enable economic development to proceed in a sustainable manner.

The objective of the first commitment period of the Kyoto Protocol was to reduce the net global emissions to 5% below 1990 level by 2012. The bar was raised to 18% for the second commitment period.

Implementation

Each party is allocated a certain amount of allowances based on their historical emissions. An allowance gives the party the right to emit 1 ton of CO2 or equivalent GHG. The amount of allocated allowance is termed as Assigned Amount Units (AAU).

There are few mechanisms which allow the party to increase its inventory of allowances:
  1. Removal Unit (RMU) on the basis of land use, land-use change and forestry (LULUCF) activities such as reforestation
  2. Emission Reduction Unit (ERU) generated by a Joint Implementation (JI) project
  3. Certified Emission Reduction (CER) generated from a Clean Development Mechanism (CDM) project

Clean Development Mechanism

CDM allows a participating country to earn an extra allowance (called CER) by undertaking a project in a developing country which helps in reducing their CO2 emission by 1 ton.

Joint Implementation

JI allows a participating country to earn an extra allowance (called ERU) by undertaking a project in another participating country which helps in reducing their CO2 emission by 1 ton.

International Emission Trading

In addition to the above mechanisms, one can buy allowances in the open market. An open market is an efficient mechanism to determine the true price of an allowance (a ton of CO2 emitted). Emission Trading allows a party to sell excess allowance to another party which could not curb its emission.

To prevent the parties from overselling their AAU and ending up falling short in meeting their own emissions targets, each party is required to maintain a reserve of allowances in its national registry. This reserve, known as the commitment period reserve, should not drop below 90% of the party's assigned amount.

At the end of the year, there is a true up where the party has to surrender the allowances equivalent to its annual emission. A penalty is imposed if the party fails to possess sufficient number of allowances.

Depending upon the carbon regime, an excess or shortage of allowances can be dealt in the following ways:
  • The excess allowance could be banked to the next period
  • The shortage of allowance could be covered by borrowing it from the next period

Monitoring and Reporting

A system has been set in place for precise recording and reporting of emission data. The adherence of the parties to their commitment is also monitored.

Greenhouse Gases Covered

  • Carbon Dioxide (CO2)
  • Methane (CH4)
  • Nitrous Oxide (N2O)
  • Hydrofluorocarbons (HFC)
  • Perfluorocarbons (PFC)
  • Sulphur Hexafluoride (SF6)
  • Nitrogen Trifluoride (NF3)


EU-Emission Trading Scheme (ETS)

Phase 1(2005 – 2007) & Phase 2 (2008 – 2012)

Phase 1 was a pilot phase that helped EU in setting up the necessary infrastructure to build a new market in Emission Trading also known as Cap and Trade Market. Phase 2 was aligned to the Kyoto Protocol's first commitment period.

The following industries were covered under this scheme:
  1. Power Plants & Utilities
  2. Oil & Gas
  3. Steel and Heavy Industries
  4. Glass & Cement
  5. Paper & Pulp

These industries emit around 45% of the net EU emissions. National Allocation Plan (NAP) was deployed where each member within the EU were allocated allowances based on their historic emission. The member state had their discretion on allocating the allowances to the industries.

The allocation to the industries could be done in either of the two ways:
  1. Free Allocation – The industry would receive the allowances without having to pay for it. The argument against this method is that it could lead to windfall profits.
     
  2. Auction – The industry would have to bid to earn the allowances. This could lead to a hefty increase in the cost to the company, the consequence of which has to be borne by the consumers. The company might lose its competiveness operating in EU’s carbon regime and thereby choose to shift to a country without such mandates. Due to this fear of Carbon Leakage, EU decided to limit the amount of allowances to be allocated by auction to 5% in the first phase and 10% in the second.

The players were not allowed to bank their excess allowances at the end of the first phase. This led everyone to the selling spree, resulting in the nosedive of the price to a few cents (from a peak of 30 Euros).

Phase 3 (2013 – 2020)

There were many lessons learnt from the previous phases which lead to major changes in the third phase. Some of the key features are listed below:
  • National Allocation Plan (NAP) was replaced by an EU wide Harmonized Carbon Regime
  • Full auction for allocating allowances to the power sector
  • 50% of the fund from auctioning to be used to fund Carbon Capture and Storage (CCS) projects
  • Free allocation of allowances for the new entrants (entrants in the power sector do not qualify)
  • A maximum of 5% of the total allowances could be used for New Entrant Reserve
  • A maximum of 50% of the required reduction in GHG emissions can be attained using CDM/JI mechanisms
  • Aviation was added to the list of industries to be covered under the scheme. Allowances equivalent to 97% of 2004-2006 average emission was allocated, 85% of which were allocated freely


Illustration


Participants


The Impact of Kyoto Protocol


The above graphs depict the trend in global CO2 emissions and EU CO2 emissions. We see a sharp decline in EU emissions after 2005, since the implementation of EU-ETS; albeit there is a decline in EU energy consumption as well which can be attributed to the global recession.

From the global perspective, we do not see any downward trend in the emission pattern. The primary reason for this monotonically increasing curve is the rapid expansion of the developing economies – China and India which largely curtails any reduction elsewhere.

This demolishes the basic foundation of the Kyoto Protocol and the Emission Trading Scheme. However this should not be looked upon as a failure. Kyoto Protocol led the industries to factor in the cost of emitting GHG in their balance sheets for the first time. It motivated them to invest in clean technologies sparking innovation in the fields of renewables and CCS. This should be taken as a call for a collaborative international effort with stringent measures to cut down the GHG emissions. The longer we remain irresolute on our actions, higher the cost of mitigating the risk gets.

The clock is ticking and it's too late to be a pessimist.


Bibliography
  1. US Senate
  2. GOV.UK
  3. Intercontinental Exchange (ICE)
  4. The Guardian
  5. Scientific American
  6. Excel Rawdata
  7. EU Member States
  8. UNFCCC - Doha Amendment


Monday, 10 November 2014

In a Nutshell - El Nino

The west coast of Peru has been a prosperous place for fishermen. The northward moving cool Peruvian Current fosters upwelling, bringing phosphates and nitrates from the deep sea to the surface. These minerals help the tiny phytoplankton to flourish. This phytoplankton bloom supports the marine food chain and invites diverse marine organisms to feed on.

However, Peruvian fishermen experience a recurring natural phenomenon during Christmas emphasized by paucity in fishing and high precipitation. They called this El Nino, Spanish for The Christ Child or an infant boy.

They also experience an entire reversal of events with a glut in fishing and drought inland. They termed this phenomenon La Nina, an infant girl.

Global Impact

El Nino and La Nina are phenomenon that occurs in the tropical Pacific, but with the energy content of a million atomic bombs, it has a cataclysmic effect on the global weather pattern.

Our planet does not receive a uniform solar insolation - tropics receiving the most heat and the poles receiving the least. Earth has developed an intricate mechanism to deal with this differential heating. There is a complex coordination between our oceans and the atmosphere to make our planet a sustainable place to live on.

Extreme weather events – drought in India and China, ice storm in the northern US can be linked to a strong El Nino whereas strengthening tropical storm in the Atlantic could be due to a knock-on effect of La Nina.

The impact this natural phenomenon in a remote part of the globe has on our entire planet is profound. The loss in lives and economic havoc created by El Nino has made it important for us to better understand its excruciating presage and take proactive measures to minimize its impact on our society.

ENSO

Southern Oscillation is the atmospheric phenomenon of the see-saw pattern of reversing surface air pressure, temperature and precipitation between the eastern and western tropical Pacific.

El Nino is the oceanic phenomenon of the flip-flop of location and depth of warm pools of water in the tropical Pacific.

The atmospheric and oceanic phenomenon is collectively called El Nino Southern Oscillation (ENSO).

When and How Often?

Based on a study, from the period of 1950 to 1997, El Nino conditions were present for 31%, La Nina for 23% and La Nada (Spanish: nothing) for 46% of the time. Although, there is no concrete number, El Nino is believed to occur every 2-7 years and each occurrence lasting 1-2 years.

La Nada

In normal scenario, Trade Winds blow from the east to the west in the tropics. These winds induce surface currents resulting in the sea surface to be 50cm higher in Indonesia than Ecuador. Sea temperature is usually 8°C higher in Indonesia as compared to Peru in the East Pacific. The high temperature in the waters of the West Pacific induces moisture laden wind to precipitate and result in higher rainfall. The East Pacific is relatively dry.


El Nino and La Nina


El Nino

La Nina

Cause

Weakening of the Trade Winds.

A surge of hot moisture laden wind blowing from the West Pacific to the East Pacific takes the charge.

Strengthening of the Trade Winds.

Trigger

If the temperature of the West Tropical Pacific is 0.5°C above long term average, it is officially declared as El Nino

If the temperature of the West Tropical Pacific is 0.5°C below the long term average, it is officially declared as La Nina

Mechanism

High Atmospheric Pressure in the West

Low Atmospheric Pressure in the East

The pool of warm water from the West Pacific moves towards Peru driven by the hot moisture laden wind. This wind brings thunderstorm and rainfall to the South American countries.


Eastward moving warm pool of water stalls upwelling in Peru and leads to the decline in fisheries.

Low Atmospheric Pressure in the West

High Atmospheric Pressure in the East

The pool of cold water from the East Pacific (brought to the equator by the Peruvian Current) move towards Indonesia driven by the strong Trade Winds. It gets warm and saturated during its journey and brings high precipitation to the West Tropical Pacific.

When this pool gets too large, it begins to slosh back eastward. Kelvin Waves which can be as long as 1000km, travels along the equator and carries warm west tropical water to the east. When it hits the South American coast, it generates long lived Rossby Waves.

Effects

Drought in usually wet Indonesia, Philippines, Australia and India.

Heavy rainfall in Peru, Ecuador, Brazil, Argentina and Southern USA.

Due to decrease in the sea level in Western Pacific, many corals in Indonesia and Australia die due to Coral Bleaching

Decline in fisheries in Peru

Drought in South American countries.

Heavy rainfall in Indonesia, Philippines, Australia and India.

Devastating effects in the Atlantic Coast of USA bringing thunderstorms and hurricanes.

Increased fisheries in Peru

Occurrence

Summer of Southern Hemisphere [Dec-Feb]

May last 1-2 years

Summer of Southern Hemisphere [Dec-Feb]

May last 1-2 years


2014: El Nino or La Nada?

2014 is predicted to be an El Nino year. The governments in several countries are taking measures to prepare themselves for its consequences. Indian government had taken proactive measures to tackle food inflation which would have resulted due to weak monsoon and failed agriculture.

The first signs of an El Nino came in January 2014, when the Trade Winds suddenly weakened, and a burst of winds from the west triggered a slow surge of warm water into the eastern equatorial Pacific. But, the atmosphere did not coordinate with the ocean to substantiate the heat content of the ocean. The El Nino eventually stalled by the end of July.

NOAA still believes that there is a 65% chance of a weak to moderate El Nino to form by the end of this year.


Notes
  1. A flourishing coral has a symbiotic relation with algae it lives with. Algae give oxygen and organic compounds to the coral. Coral, in turn, gives shelter to the algae. But, when the temperature of the ocean exceeds 28°C, coral expels the algae that thrive within, leading to a loss of pigmentation and its eventual death. This is called Coral Bleaching.


Bibliography
  1. The Oryx Resource Guide to El Niño and La Niña
  2. NOAA
  3. NEA Singapore
  4. The Guardian
  5. Nature


Sunday, 12 October 2014

Global Warming - Too Hot to Handle!

Millions of acres of forest cleared due to devastating wild fires. Tens of thousands of lives lost in catastrophic cyclones. Thousands of climate change refugees seeking for asylum. Hundreds of lives lost due to intense heat waves.


One thing is for sure, our climate is changing and it is changing fast. There is one term that tends to associate with all these natural calamities - Global Warming. There are strong indications that Global Warming is happening and it is led by anthropogenic processes.

The concept of Global Warming draws criticism mostly because of the time scale at which it operates. A chilly winter in a town will instinctively lead us to conclude that the theory is dubious. We fail to see the long term picture and the complex behavior of the nature.

Anthropogenic Causes

Fossil Fuels – Coal, Oil and Natural Gas are the foundations of the modern human society. Had it not been for fossil fuels, we would not see the myriad of human innovations around us. But it came at a cost – an imbalance in Carbon Cycle.

Forests of an area about the size of Scotland are destroyed every year [1] for building settlements and farmlands for our inflating population. This again has aggravated the imbalance in the Carbon Cycle.

Carbon Equation

CO2 Released by Natural Processes [2][note] + CO2 Released by Anthropogenic Processes > CO2 Sequestered by Natural Processes
(439 Gt per annum)   (35 Gt per annum)   (450 Gt per annum)

43% of the extra CO2 has accumulated in our atmosphere, 28% in our ocean and 29% on our land [2].

The extra CO2 in ocean has turned it acidic and its pH has decreased by 0.1 [2] since the start of industrial era. This has posed a threatening condition for delicate marine organisms like corals and jellyfish.

The extra CO2 in our atmosphere is responsible for trapping more heat from the sun. Ocean warming dominates the increase in energy stored in the climate system, accounting for more than 90% of the energy accumulated between 1971 and 2010. It is virtually certain that the upper ocean (0-700 m) warmed from 1971 to 2010 [2].

Climate System

Our climate system is an inexorably convoluted system involving complex interactions between atmosphere and ocean.

Some of the factors affecting global temperature are:
  1. Concentration of CO2, CH4 and N2O in our atmosphere
  2. Aerosols, dust particles (due to volcanic activities) and clouds that reflect the sunlight back to space
  3. Solar Climate which is supposed to work in the cycle of 11 years [3]
  4. Ocean circulation cycles like El Nino, La Nina, Pacific Decadal Oscillation, Atlantic Decadal Oscillation

Negative Feedback

The negative feedbacks tend to soften any change in our climate system. For example, higher temperature leads to greater evaporation which in turn increases the amount of cloud in our atmosphere. This results in decreased insolation and thus helps maintain equilibrium [4].

Positive Feedback

On the other hand, positive feedbacks tend to aggravate any change in our climate system.

  1. As the extent of ice sheets in the Arctic and Greenland is decreasing, the amount of sunlight reflected by the Earth’s surface is decreasing. This has resulted in decreased albedo and increased insolation.
     
  2. The appalling rate at which the ice sheets are melting is resulting in the formation of Moulin. Moulin creates a pathway for the melted water on the surface of ice sheet to its bottom. This leads to lubrication of the surface on which ice sheets move. Hence the rate at which ice sheets move towards the sea has increased dramatically [5].


  3. There is an immense amount of CH4 seated deep beneath the Alaskan and Siberian permafrost. As the permafrost are getting exposed due to melting ice sheets, their thawing could lead to emission of far more lethal greenhouse gas [6].

Environmental Repercussions

There have been several research papers on the environmental repercussions due to global warming. The conclusions are based on observations and modelling. Of course, no one can say anything for certain. But, we should regard these conclusions as a pin to break the shell of delusion that some of the critics are living in. In this fragile ecosystem, we must inhibit ourselves from being myopic and closed minded.

  1. As the upper ocean is getting warmer, it creates an appropriate precondition for the inception of cyclones. This could be the reason why we are witnessing high intensity cyclones for last few years.
     
  2. The surge in the sea level driven by thermal expansion and melting of ice sheets has claimed low lying lands and has begotten climate change refugees [7].
     
  3. The number of cold days and nights has decreased and the number of warm days and nights has increased on the global scale [2].
     
  4. Extreme heat waves and cold waves would be more frequent. The recent Polar Vortex in Northern America is one of its examples [2] [note].
     
  5. Due to the increase in moisture availability, the El Nino effect is likely to get intensified at regional level. This may lead to devastating effects on the Pacific coasts [2].
     
  6. A warm and dry condition in forests could be a perfect prerequisite for fire to escalate [8].
     
  7. A warmer environment would provide a preferable condition for mosquitoes and pests to flourish. This is likely to pave a path for Malaria epidemic in future [9].

Couldn't we evolve?

Our planet has never been a constant. But, the natural change in the climate is a very slow process allowing species to adapt to the change. The atmospheric concentration of CO2 now substantially exceeds the highest concentration recorded in ice cores during the past 800,000 years. It is without any doubt that anthropogenic processes have caused changes to our environment that are unprecedented in the past 800,000 years [2].

250 million years ago, our planet was facing similar situation as today. Intense global warming and the positive feedbacks led to a tip-off point in the climate. The abrupt change in the environment didn't allow species to adapt. This came to be known as Permian–Triassic extinction event [10], the greatest mass extinction on our planet.

The species living 250 million years were not intelligent enough to understand the change or possibly do anything to evade it. But, we human beings are different and have enough knowledge and capability to hedge our risks. Shall we not take any responsibility to protect our legacy?

We buy all sorts of insurances - life insurance, car insurance, etc - in our lives. This implies we are investing for precarious events that might unfold in future. So, what makes people question the investment done towards sustainable environment and greener future?

Care About the Planet

Are we doing this to save our planet?

This is absolutely not a quest to save Earth! Our planet doesn't need our care! It is mighty enough to take care of itself. This is about us! This is about the greatest specie that has ever lived on this planet; the specie that cared to be inquisitive; the specie that cared to understand the nature; the specie that cared to think about the future.

Our planet has sustained complex life for last 500 million years. During these 500 million years, our planet has had several catastrophic events leading to tumultuous conditions. Species came, flourished and perished, yet our planet didn't lose its aura. It retained its capability to restore equilibrium and gave opportunity to different set of organisms to flourish.

The giant invertebrate insects ruled the planet 300 million years ago [11]. 100 million years ago, our planet favored the reptiles. The mammals are certainly the blessed ones in the current environmental condition. Who knows which group of animal is next on the list?

Our future is in our hand. If we do not take responsibility, a tip-off point in our climate system would not be a matter of 'if'; it will be a matter of 'when'!


Notes
  1. Including forest fire and volcanic activity (250 Mt per annum) [ref]
  2. The atmospheric current called Jet Stream and the oceanic current called Gulf Stream are the major forces responsible for keeping Northern America and North Western Europe warm. Jet Stream prevents the cold air over the Arctic to come south and Gulf Stream distributes the warm equatorial water to the North Atlantic coasts. Due to the warming Arctic and the loss in temperature differences, the Jet Stream and the Gulf Stream are getting weak and hence breaking the engine that keeps the North Atlantic coasts warm.[ref]
  3. Future Map of Sea Level Rise [ref]
  4. Key takeaways from IPCC AR5

Bibliography
  1. BBC - Power of the Planet
  2. IPCC
  3. NASA
  4. Robert Hazen – The Story of Earth
  5. NASA
  6. United Nations Environment Programme
  7. National Geographic
  8. National Geographic
  9. World Health Organization
  10. National Geographic
  11. BBC - How to Grow a Planet

Images
  1. Polar Bear - Mr Wallpaper
  2. Moulin - NOAA Arctic


Monday, 25 August 2014

Arctic Drilling – Worth the Risk?


Imagine a landscape with snow covered mountains, pristine seas and extreme wilderness, unscathed by human intervention; a place unparalleled in its beauty, serenity and peace. Suddenly there is a cacophony of ice breakers, clatter of drill bits and sloppy spills of oil around. This is the kind of picture that we tend to paint to depict the story of Arctic Drilling. The usual antagonists here are the oil companies.

The burgeoning energy demand to fuel the economy and fickly energy supply has pushed the oil companies to reach out for new frontiers.

Energy Security

Energy Security in simplest terms is defined as undisrupted supply of energy at an affordable price. The need to ensure energy security and decrease the dependence on supplies from politically tumultuous Middle East and Africa has led the oil exploration business to the Arctic.

Unquenchable Demand

In 2012, the global primary energy consumption was 90 bboe. The Oil and Gas comprised of 57% of the share – 52 bboe.

According to BP, the primary energy demand is expected to increase by 41% between 2012 and 2035. Oil, Gas and Coal will take an equivalent share of 27% each. This implies the primary energy consumption of 127 bboe with Oil and Gas taking 68 bboe of the share.

For simplicity if we assume a linear growth in our energy demand from 2012 to 2035, we would need around 1400 bboe of Oil and Gas during this period. Our current proven reserve estimates which can be recovered with existing technology are 1700 bboe for Oil and 1300 bboe for Gas. A vast majority of these reserves lie in the Middle East.

To ensure energy security and sustainability in our society, it is a necessity to explore and look out for new frontiers. But the question remains, Is Arctic worth taking the risk?

Arctic Geography


The Arctic is defined as the region located north of the Arctic Circle - the 66°34`N latitude. While Antarctica is a continent surrounded by ocean, Arctic is an ocean surrounded by continents.

About 1/3 of the Arctic is occupied by land with another 1/3 consisting of offshore continental shelves located in seas less than 500 meters in depth. The remaining 1/3 is the Arctic Ocean with waters deeper than 500 meters. The maximum depth of the Arctic is 5000m.

It is the offshore continental shelves in the Arctic which is particularly interesting to the geologists. It consists of basins and deltas which imparts favorable condition for oil fields to be found.

Players of the Arctic


There are eight countries that lie in the Arctic – United States, Canada, Greenland/Denmark, Iceland, Norway, Sweden, Finland and Russia. Iceland's portion of territory in the Arctic is small and lacks the potential of incorporating oil field. Sweden and Finland do not border the Arctic Ocean and, thus, do not have any jurisdictional claims in the Arctic Ocean.

Hence, the players in the Arctic are - United States, Canada, Greenland/Denmark, Norway and Russia.

The UN Law of Sea Treaty grants sovereign rights to a coastal nation on the natural (living and non-living) resources up to 200 nautical miles (called Exclusive Economic Zone) from the coastal baseline. The sovereign right over non-living resources can exceed beyond the EEZ in the area called Extended Continental Shelf. The farther the extension of the continental shelf, the more area the coastal nation can claim.

The Lomonosov Ridge discovered by Russia in 1948 is claimed by Russia, Denmark and Canada as part of their continental shelf.

Canada and United States have been disputing their claims in Beaufort Sea due to misinterpretation of the treaty signed by Russia (when Alaska was a part of Russia) and the British (when Canada was under British rule) in 1825.

Norway and Russia had a dispute in the offshore boundary in Barents Sea which was resolved simply by dividing the disputed area in half.

The Arctic Potential


Some of the important features about the Arctic oil fields are:
  1. About 84% of the estimated resources are expected to occur offshore.
  2. More than 50% of undiscovered oil resources are estimated to occur in three geological provinces - Arctic Alaska, AmerAsia Basin and East Greenland Rift Basins.
  3. More than 70% of undiscovered natural gas is estimated to occur in three geological provinces - Arctic Alaska, West Siberian Basin and East Barents Basins.
  4. West Siberian Basin and East Barents Basin hold 47% of the undiscovered Arctic resources, with 94% of those resources being natural gas and natural gas liquids (NGL).
  5. While the Eurasian side of the Arctic is more natural gas prone, the North American side is more oil prone. The North American side of the Arctic is estimated to have about 65% of the undiscovered Arctic oil, but only 26% of the undiscovered Arctic natural gas.

Discovered Fields


The above map represents the number of discovered fields with proven reserve greater than 500 mboe.

Risk

Although Arctic Sea is pretty shallow in the areas of potential oil deposits, the harsh conditions imposed makes the drilling intractable. Only the large fields with reserve greater than 500 mboe are economically viable for the companies to drill the wells on. The myriad of environmental, logistical and social problems aggravate the misery of oil companies.

To operate in the conditions of extreme cold, stern darkness and turbulent sea during the winter would require higher investment in equipment and wages for the workers. Icebergs moving at speed of 700 meters per hour could damage the oil rig and riser pipe causing oil spill. The unpredictable weather and devastating waves up to 10m high are common traits of the Arctic.

The construction of pipeline to transport oil from the remote areas to the refineries down south is expensive and difficult due to poor soil conditions. As Arctic is majorly composed of natural gas, construction of LNG liquefaction plant will be necessary which again would add to the expense. The tanker ships carrying LNG to different parts of the world would face challenging condition sailing through the Arctic ice.

The shallow waters of the Arctic provide sanctuary for the wildlife. Any oil spill would be an environmental disaster and threaten their existence.

Oil Spill

One of the most controversial topics on Arctic Drilling is dealing with oil spills. Oil companies are spending huge amounts of money to upgrade their capabilities to prevent oil spills. The footprints of oil spill are largely unknown. The inexorable weather condition and lack of local infrastructure would hamper the relief process.

The following steps are taken in an event of oil spill:
  1. Containing the oil using booms
  2. Skimming off the oil atop the water
  3. Burning off the oil
  4. Using dispersants to break off the heavier hydrocarbons
  5. Leaving off the oil for natural degraded by microbes called Alcanivorax Borkumensis

None of these measures would be effective in the ice laden Arctic Sea. The condition would worsen if the spilled oil gets soaked into the ice which could transport it to thousands of miles away from the epicenter.

The only viable solution would be to drill during the summers when ice has retreated north leaving area around the wells ice-free.

Accidents


  1. In March 1989, Exxon Valdez supertanker hit a reef in Prince William Sound leading to a spill of 260, 000 barrels of oil. The drunken captain was the culprit of the worst spill US had witnessed then.
  2. In March 2006, a leak in pipeline operated by BP in Prudhoe Bay which went undetected for several days led to a spill of 5000 barrels of oil.
  3. On 31st December 2012, Shell's Kulluk ran aground off the southern coast of Alaska in a violent storm. Although there was no environmental effect of this accident, it was a realization of technological puniness amidst nature’s fury.

Regulatory Environment

Given the harsh conditions and repercussions of any incident on the fragile ecology of the Arctic, a stringent regulatory environment needs to be imposed. The players in the Arctic should collaborate to broaden their technological prowess and ameliorate their safety measures.

Only the relatively calm area in an ice free condition should be taken into consideration for licensing. The companies with strong commitment towards adherence to the regulatory guidelines, proactive disaster management plans and state of the art drilling technologies should be granted the lease.

Opinion

The ongoing revolution in Shale Oil and Gas has definitely diverted the attention of United States away from the Arctic. With the unproven shale reserves exceeding 1500 bboe, Arctic is not a frontier worth taking the risk, in my view.


The investment done to explore and develop the shale and tight oil and gas reserve would be more lucrative than confronting the Arctic wrath.


Units
  1. mboe = million barrels of oil equivalent
  2. bboe = billion barrels of oil equivalent
  3. tcf = trillion cubic feet

Bibliography
  1. Imperial College London
  2. Duke University

Photos and Maps
  1. National Geographic
  2. Shell
  3. EY
  4. Durham University


Monday, 14 July 2014

Law of the Sea Treaty

When the Freedom of the Seas doctrine was signed in the seventeenth century, little was known about the ocean and its economic values. The ocean was just a vast expanse of water acting as a barrier to human being’s insatiable craves for new territories. The doctrine thus limited a nation’s sovereignty just beyond 3 miles of its coastal baseline. The water beyond that was free for everyone but belonged to none.

With the burgeoning energy demand and surge in our technological capabilities, we had to push ourselves off the lithosphere into the new frontier of hydrosphere. As the technology developed and we got a better understanding of plethora of natural resources that oceans offer; as the strategic importance of coastal water for national security was realized, conflicts began to develop over the ownership of the oceans.

The LOST

The growing complexities of our sophisticated society clamored for an international framework on the law governing the ownership of seas and oceans. The UN council then came up with the Law of Sea Treaty (LOST) in 1973. But due to conflict of interests amongst several nations it could not come to enforcement until 1982.


Baseline

Normal Baseline - the low water line along the coast. Anything landwards of the baseline – rivers, lakes or canals is internal to the coastal nation.

Straight Baseline - The baseline could be deviated in certain cases from its normal definition:
  • Deeply indented and cut into coastline.


  • Fringe of islands along the coast.


  • Historic significance of water. Eg: Libya’s Line of Death to include Gulf of Sidra as internal waters.
     
  • In case of Archipelago, if the ratio of area of water to that of land is between 1:1 and 9:1, then the archipelagic nation is allowed to draw its baseline joining the outermost points of the outermost islands.
     

Territorial Sea

Any coastal nation will get the sovereignty over the airspace and the stretch of water 12 nautical miles (NM) seawards of the baseline.

Contiguous Zone

This is the zone contiguous to the territorial sea and may not extend beyond 24 NM from the baseline. The rights of the coastal nation within this zone are to:
  • Prevent infringement of its customs
  • Ensure sanitation by demanding health check of the crew or passengers onboard a ship

Exclusive Economic Zone (EEZ)

EEZ is an area beyond territorial sea and not extending beyond 200 NM from the baseline. This region grants the sovereign rights to the coastal nation for the purpose of exploring and exploiting, conserving and managing the natural resources, living or non-living, of the waters, seabed and its subsoil.

Land locked states also has the right to exploit an appropriate part of the surplus of the living resources of the EEZ.

Continental Shelf

The continental shelf of a coastal state comprises the seabed and subsoil that extends to a distance of 200 NM from the baselines. In accordance with the EEZ which is a part of the continental shelf, the coastal state exercises sovereign rights for the purpose of exploring and exploiting its natural resources. However, all states are entitled to lay submarine cables [1] and pipelines on the continental shelf.

Extended Continental Shelf/Outer Continental Shelf

The coastal state has sovereign right over non- living resources in the ECS (or OCS) but no right over the living resources.

The ECS could extend to the length given by the following formula:

Maximum of (60 NM ahead of the foot of the slope [2] AND Line where thickness of sediment [4] is 0.01 times its length from the foot of the slope)


However, its distance from the baseline cannot exceed the length given by the following formula:

Maximum of (350 NM from the baseline AND 100 NM ahead of the 2,500 meter isobath [5])


High Seas

The high seas are the stretches of water beyond 200 nm from the baseline. All states, whether coastal or land-locked, are entitled to fish and lay submarine cables and pipelines on the bed of the high seas.

Innocent Passage

A foreign floating vessel complying with the terms of being innocent and desiring to cross territorial water of a coastal nation has the right of Innocent Passage. Any submarine has to navigate to the surface and raise its flag during the procedure. The coastal state can implement sea lanes in its territorial sea to manage traffic.

Transit Passage

Transit Passage grants the freedom of navigation and overflight solely for the purpose of continuous and expeditious transit across a Strait [6].


Notes
  1. A Submarine Communications Cable is a cable laid on the sea bed between land-based stations to carry telecommunication signals across stretches of ocean. Modern cables use optical fiber technology to carry digital data, which includes telephone, Internet and private data traffic.
  2. Foot of the Slope is the point of maximum change in the gradient of the continental shelf at its base. This is calculated by analyzing Bathymetric Data.
  3. Bathymetry is the study of underwater depth of lake or ocean floors.
  4. Thickness of the sediment is calculated by analyzing seismic data.
  5. Isobath is a line on a map connecting points of equal underwater depth.
  6. Straits connect one High Sea or EEZ to another. The states bordering straits may designate sea lanes for navigation in straits to promote the safe passage of ships.

Bibliography
  1. US Naval War College
  2. United Nations
  3. Department of States
  4. American Geophysical Union


Monday, 16 June 2014

Keystone - Key Stepping Stone for the Oil Sands

The TransCanada Keystone XL Pipeline Project is a proposed 1,897km crude oil pipeline connecting Hardisty in Alberta, Canada to Steele City in Nebraska, USA where it will join an already operating pipeline leg to connect it to the refineries at the US Gulf Coast.


This pipeline is designed to deliver up to 730,000 barrels per day (bpd) of Alberta Oil Sands and 100,000 bpd of Shale Gas from Bakken Formation to the refineries at the Gulf Coast. The refineries have been upgraded to refine unconventional bituminous crude.

The Fuss

The total length of existing pipelines in US exceeds 750,000km. The fuss created over this 1,897km is due to its strategic importance and environmental repercussions.

US Energy Policy is clearly driven to reduce its energy dependence on politically tumultuous Middle East and Venezuela which is shifting its attention more towards China. Thanks to the shale revolution, US has witnessed sharp boost in its energy production which now provides 60% of its consumption. 20% of its oil imports come from Canada, 50% of which is Oil Sands. Oil Sand is important to US not only because it accounts for substantial amount of oil imports but also because it is cheap and comes from a friendly neighborhood.

Oil Sand is an unconventional form of oil deposit and emits 10-15% extra greenhouse gases (GHG) during its entire lifecycle. Environmentalists have challenged the building of Keystone which, in their view, would ramp up the production of dirty oil sands.

Oil Sands

Oil Sand is a naturally occurring mixture of sand, clay, water and bitumen.


There are two methods to produce crude from the oil sands:
  1. In Situ - Accounting for almost 50% of total oil sands production, it uses Steam Assisted Gravity Drainage (SAGD) whereby superheated steam is injected underground leading the bitumen to ooze out of the well.
     
  2. Surface Mining - Heavy machineries are used to crush the sand which is then mixed with heated water to wash out the bitumen. The crude thence produced is heavy and extremely viscous. Thus, it needs to be diluted before it is sent over to the refineries.

Alberta's Oil Sands is the third largest proven crude oil reserve in the world, next only to Saudi Arabia and Venezuela. The Athabasca oil sands deposit in Alberta contains 173 billion barrels of proven oil reserve. The total oil sands production in Alberta was 1.9 million barrels of oil per day (mbpd) in 2012 and is expected to reach 3.8 mbpd in 2022.

With greater power, comes greater risk.

Alberta Oil Sand is found in the low lying river valley surrounded by dense forests and lakes. The extraction of sands buried beneath the soil would naturally upset the local flora and fauna. The water based extraction process uses about 2-4 barrels of water for each barrel of oil produced. This results in the accumulation of immense amount of waste water, known as tailings. The waste water management is another environmental challenge.

As with any pipeline, there is always a risk of oil spill which could seep to the underground aquifers and poison the local fresh water supply.

To XL or excel, that is the question

BP has recently published a report which forecasts the global energy consumption to rise by 41 per cent from 2012 to 2035. With the massive potentials of Alberta Oil Sands, it is quite evident that it will eventually make its way to the market. If it cannot pave its path to the US, another oil thirsty nation will step in. In a nutshell, the oil sands won’t be staying in Alberta too long.

Keystone is probably the cleanest and safest way to bring the oil to the US refineries. The railways have been the traditional way to carry oil to the US refineries. The recent accidents in Quebec and North Dakota have jeopardized its potential.

Open to criticism

It is the friction between the opposing forces that tend to produce an optimum, socially acceptable solution to a problem. US has not only the best technology to harness natural resources but also the most aggressive environmentalists in the world. The outcome of contention and inexorability has been rewarding indeed. The energy production in US increased by more than 10% in past five years, but for the same time range its emission reduced by more than 10%.

This trend of accepting criticism by the US is commendable. In response to the latest State Department's SEIS report, Mr. Obama said he would only approve the pipeline if it did "not significantly exacerbate the problem of carbon pollution. The net effects of the pipeline's impact on our climate will be absolutely critical to determining whether this project is allowed to go forward".

The Battle

An affirmative nod, if in case, for the construction of Keystone XL should not be viewed as a battle lost by environmentalists. Their adamancy and commitments by involved industries has provided substantial amount of investment in the budding field of Carbon Capture and Storage (CCS). Their quest has led to re-designing of the pipeline plan and enhanced regulations both in the US and Canada:
  • limitation on the amount of water to be withdrawn from the Athabasca River
  • better waste water disposal plan
  • enhanced recycling of water
  • robust disaster recovery plan
  • efficient use of land and better reclamation measures
  • to pay $15 per tonne of CO2 extra emitted over a fixed reduction target

Back Down South

It is quite clear that in its quest to become energy independent, US has chosen Canada to be its close friend. However the relationship with its neighbor down south appears to be blurry. Immensely resourceful but plagued by its nationalistic view on its oil, Mexico's oil exports have dropped to trickle. Yet it contributes for more than 10% of US's oil imports.

Enrique Peña Nieto's revolutionary energy reform would definitely lead to drastic increase in the Mexican oil production. The opening up of Mexico's oil sector to foreign investment would uncork much awaited prospects in the Gulf of Mexico and Eagle Ford Extension. This news would be more euphoric to the refineries at the Gulf Coast than the approval of Keystone.


Bibliography
  1. The Quest - Daniel Yergin
  2. National Geographic Magazine
  3. Alberta Oil Sands
  4. TransCanada Keystone
  5. Department of State - Environmental Impact Statement


Sunday, 11 May 2014

Energy - The Past, The Present and The Future

The human society is carved by energy. The plethora of human innovations that we see around credits its existence to our expertise in harnessing energy in various forms.

The Past


The above graph [1] elucidates the pattern in energy consumption by human beings right from their inception:
  • Primitive - When we used to live a primitive lifestyle 2 million years ago, our energy demands were limited to food.
     
  • Hunter - After we learnt the art of controlling fire, our lifestyle changed and we started spending resources on building shelters for protection and socializing.
     
  • Agriculture - Nearly 10,000 years ago, our burgeoning population and sparse resources led our survival instincts to grow food rather than search for it. This led to the invention of agriculture.
     
  • Tools - As we grasped the art of agriculture, the knack came in with the invention of tools. Contemporarily, agriculture also allowed us to settle down and form civilization. As our society gradually became complex, so started the advent of our energy demand.
     
  • Industrial - Industrial Revolution started with James Watt’s historic invention of Steam Engine. Our insatiable crave for energy shifted our attention to the pockets of chemical energy in the forms of coal, oil and gas.
     
  • Technology – Energy mostly in the form of fossil fuels now occupy the entire spectrum of human desires.

The Present

The following table [2] gives an insight on the global energy consumption per day:


Some contrasting features:
  • The average per capita monthly consumption of electricity is around 225 KWh
  • 58.21 KWh of energy per capita per day is equivalent to the energy required by an average [c] car to travel 70 km
  • Amount of solar energy absorbed by Earth's atmosphere, oceans and land masses is more than 10,000 EJ per day. In contrast to that, our consumption is just 538.98 EJ per annum

The Future

Fossils Fuels and Nuclear Fuels are non-renewable and the time will come when they will eventually perish. But how far is that day [1]?


We have sufficient proven reserves of oil and gas to easily last another 50 years. The ongoing shale revolution and technological innovations to extract tight oil has a potential to give it another 100 years. Thanks to the abundance in our coal reserves, the dearth of coal will not be a matter of contemplation in near future.

In my view, it is not the "peak oil" or "wells going dry" that should worry us, it should be the environmental repercussions of using fossil fuels. The failure to inhibit carbon emission would lead the global temperature to surge to such an extent that a positive environmental feedback would trigger. And when we reach that tipping point, it would be too late to react…


Notes
  1. Primary Energy refers to the energy sources as found in their natural state. Primary Energy Sources are transformed in energy conversion processes to Secondary Energy Sources which are more convenient forms of energy that can directly be used by us (such as electrical energy or fuels)
  2. Population = 7046368813
  3. Average Mileage of a car = 25 miles/gallon of gasoline
  4. 1 barrel of oil equivalent (boe) = 1.7 MWh
Resources
  1. Research Gate
  2. BP
  3. NEA
  4. Excel Data
Bibliography
  1. UN
  2. SPE
  3. Iowa State University


Sunday, 13 April 2014

In a Nutshell - Cyclones

A cyclone is a huge system of rotating wind around a large scale low pressure area called "eye".

The rotation of wind is anti-clockwise in the Northern Hemisphere and clockwise in the South. This is due to Coriolis force which acts on a moving body (Wind) in a rotating reference frame (Earth).


Tropical Cyclones are known by different names in different areas:
  • Hurricanes in the North Atlantic & Eastern Pacific
  • Typhoons in Western Pacific

Tropical Cyclones arise over ocean in the tropical latitudes (5°N - 15°N) where Coriolis force is substantial enough to stabilize its low pressure eye.

There are two factors that fuel its growth:
  1. Evaporation - When the temperature of the ocean surface (up to the depth of 50 m) exceeds 28°C, it intensifies evaporation. The warm and moist air above the ocean rises to create low pressure region. The cooler air swirls around to take its place.
  2. Condensation - As the warm air rises, the water vapour condenses to form clouds and droplets of rain. This releases latent heat. This heat combined with heat from the ocean triggers more evaporation which in turn leads to greater condensation (chain of events)!
If Tropospheric Vertical Shear (change of wind velocity with height) is low, the storm builds into a cyclone within two to three days. Otherwise, frequently changing speed and direction of wind in upper atmosphere would halt the progress of storm in the upward direction.

When formed, a cyclone is roughly 600 km across and 15 km high. The winds in it can speed over 100 kmph. The eye of a cyclone is the region of lowest pressure and highest temperature (as compared to surrounding region). It experiences relatively calm wind and fair weather. It is usually about 50km across.

After the cyclone is formed, it is steered by the Trade Winds (global winds that blow predominantly from east to west in the Northern Hemisphere) which is responsible for Hurricane Landfalls in North America.

After reaching the land, the break in chain of evaporation and condensation diminishes the energy of the cyclone. Hence, it dies within few days after landfall.

The fancy names of Tropical Cyclones are used basically to facilitate easy communication. A list of 21 names is prepared for each year. The first tropical storm in that year is given the name with A; the second storm is given the name with B and so on(excluding the ones starting with Q, U, X, Y and Z).


Bibliography


Sunday, 9 March 2014

In a Nutshell - Atmospheric Circulation

Our atmosphere is incredibly powerful and is responsible for regulating our planet's temperature.

Due to uneven heating of the Earth’s surface, there is a heat surplus in the tropics and a heat deficit at the poles. The interaction between our atmosphere and the oceans to fill up this gap in the heat content makes our planet a sustainable place to live in.

The way our atmosphere performs this temperature regulation is by building up several giant convection cells. These convection cells are driven by:
  • Temperature Gradient
  • Pressure Gradient
  • Coriolis Force (deflects the wind to the right in the Northern Hemisphere and vice versa)

The atmospheric cell has two arms:
  1. Low Altitude Arm - It blows at the surface of the earth. It is also called the Prevailing Winds as it remains constant on an average throughout the year.
  2. High Altitude Arm – It constitutes the winds that blow in the high altitude troposphere.

There are three convection cells in each hemisphere of the Earth:
  1. Hadley Cell (10° - 30°)
    When the warm moist air in the tropic rises and moves northwards (towards the pole) it is deflected to the east (in the Northern Hemisphere) due to the Coriolis Effect. At 30° latitude, the air cools down and sinks. It then moves southwest towards the equator to complete the cell. The low altitude arm of the Hadley Cell or the Prevailing Wind blows from the Northeast to the Southwest (in the Northern Hemisphere). They are called the Easterlies or the Trade Winds.
     
  2. Farrel Cell (30° – 60°)
    Unlike other cells, Farrel Cell is induced by the effect of other cells and behaves like an atmospheric ball bearing. The Prevailing Winds blow from the Southwest to the Northeast and are called the Westerlies.
     
  3. Polar Cell (60° – 90°)
    When the cold dry air at the pole descends and moves southwards it is deflected to the west. This wind, near to the surface of the earth, is called the Polar Easterlies.


Between these regions of strong prevailing winds, there are regions of calm air:
  1. Doldrums (or Intertropical Convergence Zone)
    The equatorial humid region where warm moist air rises and shreds off its moisture as it cools.
     
  2. Horse Latitude
    The high pressure boundary between the Hadley and the Farrel Cell at 30° latitude. This is the region where cool dry air descends. The major deserts on our planet lie at this latitude.


Images

Bibliography